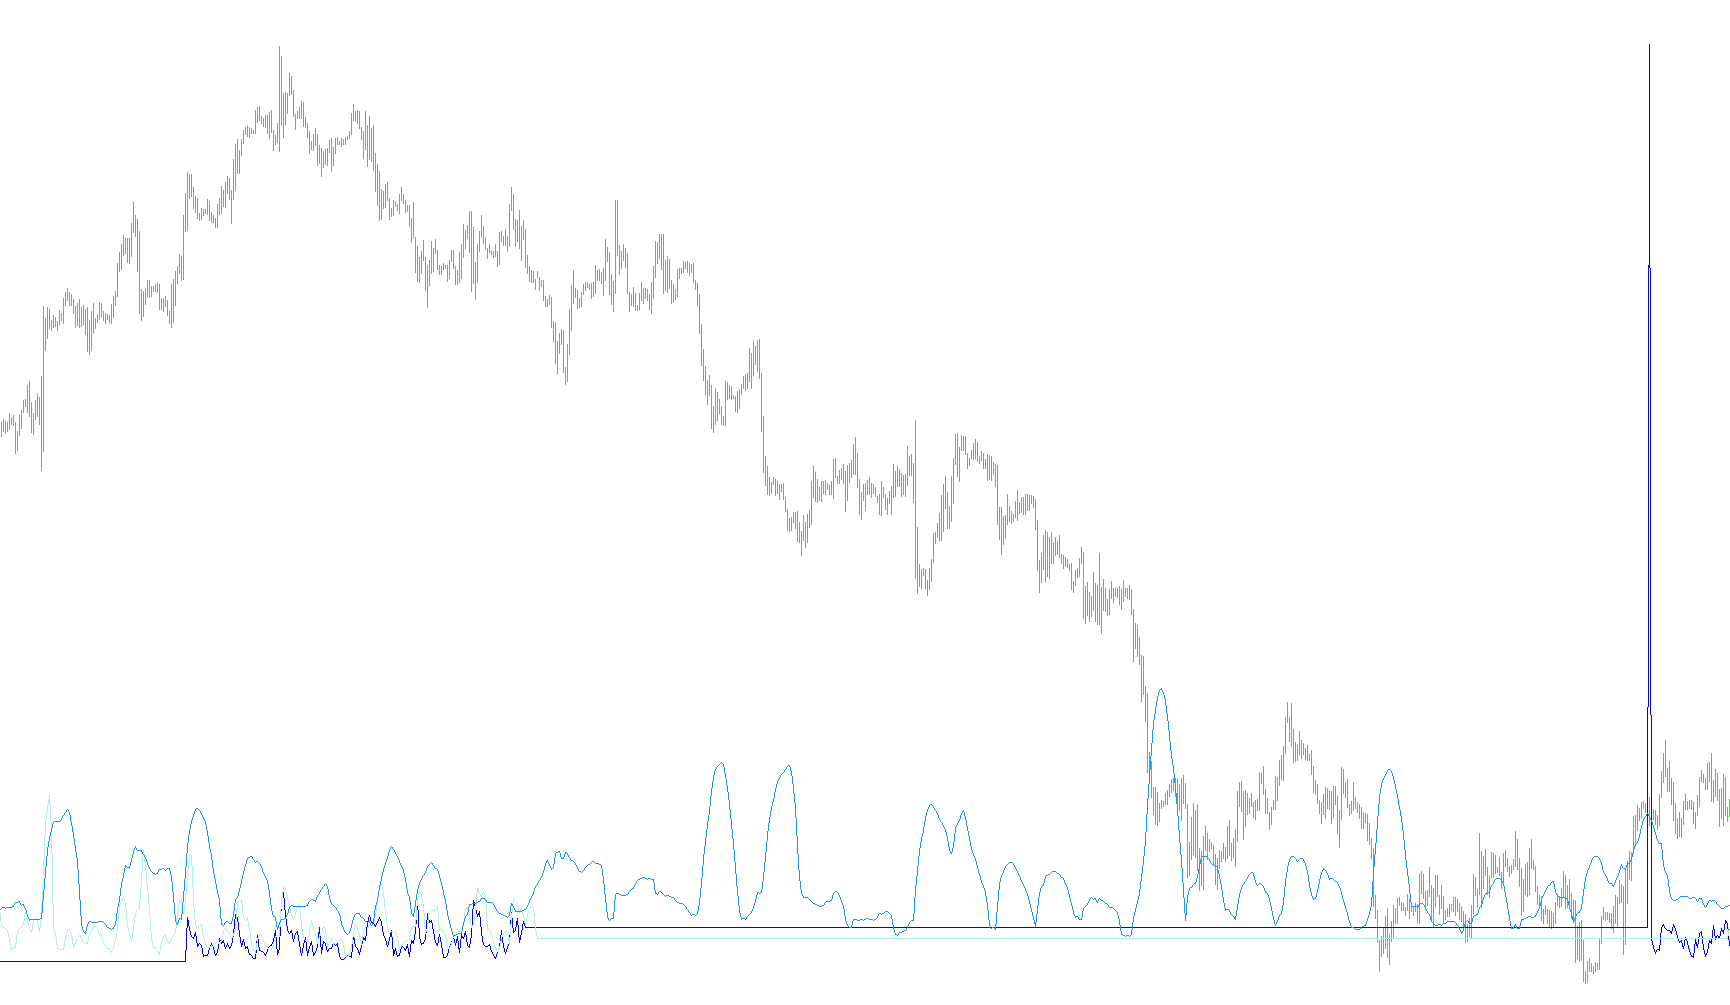
This tool is designed to help traders visualize market volatility by analyzing price fluctuations across multiple time horizons simultaneously. Instead of looking at a single chart, it gathers data from different intervals to provide a comprehensive view of how the market is behaving in the short, medium, and long term.
Core Functionality
The primary logic of this script revolves around calculating "Standard Deviation"—a mathematical measure of how much price action deviates from its average. By monitoring these deviations, the tool helps identify whether the market is currently stable or experiencing significant swings.
Multi-Timeframe Integration
What makes this specific tool unique is its ability to perform "Multi-Timeframe" (MTF) analysis. While you are looking at your current chart (for example, a 1-minute chart), the script automatically reaches out to pull data from other timeframes, such as 5-minute, 15-minute, or 60-minute intervals.
It synchronizes this data so that you can see the volatility of these different time periods plotted on your primary screen at once. This allows for:
- Contextual Awareness: You can see if a small price movement on your current chart is just "noise" or if it aligns with a larger trend happening on higher timeframes.
- Trend Alignment: By comparing the visual lines from different periods, traders can better understand the overall momentum of the market.
Visual Representation and Customization
The script displays these various data points as distinct colored lines in a separate window on your platform:
- Current Chart: Represented by one specific color (Aqua).
- Additional Timeframes: You can choose to activate up to three additional timeframes, each assigned its own unique color (Green, Blue, and Brown).
User Experience
To keep the interface clean, the tool provides a dynamic text comment on your screen. This label acts as a legend, clearly identifying which color corresponds to which timeframe based on your specific settings. This ensures that even with multiple lines on the screen, you can immediately distinguish between short-term volatility and long-term market trends.
/*------------------------------------------------------------------+
 |                                                 MTF-StdDev-4.mq4 |
 |                                                 Copyright © 2012 |
 |                                             basisforex@gmail.com |
 +------------------------------------------------------------------*/
#property copyright "Copyright © 2012"
#property link      "basisforex@gmail.com"
//----------------------------------------
#property indicator_separate_window
#property indicator_buffers 5
#property indicator_color1 Aqua
#property indicator_width1 2
#property indicator_color2 Green
#property indicator_width2 2
#property indicator_color3 Blue
#property indicator_width3 2
#property indicator_color4 Brown
#property indicator_width4 2
#property indicator_level1 100
#property indicator_level2 -100
//-------------------------------------
extern string     TimeFrames     = "1; 5; 15; 30; 60; 240; 1440; 10080; 43200";
extern bool       TimeFrame2bool = true;
extern int        TimeFrame2     = 5;
extern bool       TimeFrame3bool = true;
extern int        TimeFrame3     = 15;
extern bool       TimeFrame4bool = true;
extern int        TimeFrame4     = 60;
//-----
extern int        ma_period      = 20;
extern int        ma_shift       = 0;
extern int        ma_method      = 0;
extern int        applied_price  = 0;
//-----
double s1[];
double s2[];
double s3[];
double s4[];
//+------------------------------------------------------------------+
int init()
 {
   SetIndexBuffer(0, s1);
   SetIndexBuffer(1, s2);
   SetIndexBuffer(2, s3);
   SetIndexBuffer(3, s4);
   //-----
   SetIndexStyle(0, DRAW_LINE);
   SetIndexStyle(1, DRAW_LINE);
   SetIndexStyle(2, DRAW_LINE);
   SetIndexStyle(3, DRAW_LINE);
   //-----
   return(0);
 }
//+------------------------------------------------------------------+
int start()
 {
   int limit, x;
   int counted_bars = IndicatorCounted();
   if(counted_bars < 0) return(-1);
   if(counted_bars > 0) counted_bars--;
   limit = Bars - counted_bars;
   //-----
   for(x = 0; x < limit; x++)
    {
      s1[x] = iStdDev(NULL, 0, ma_period, ma_shift, ma_method, applied_price, x);
    }
   //-----
   if(TimeFrame2bool)
    {
      for(x = 0; x < limit; x++)
       {
         s2[x] = iStdDev(NULL, TimeFrame2, ma_period, ma_shift, ma_method, applied_price, iBarShift(NULL, TimeFrame2, Time[x], false));
       }
    }
   //-----
   if(TimeFrame3bool)
    {
      for(x = 0; x < limit; x++)
       {
         s3[x] = iStdDev(NULL, TimeFrame3, ma_period, ma_shift, ma_method, applied_price, iBarShift(NULL, TimeFrame3, Time[x], false));
       }
    }
   //-----
   if(TimeFrame4bool)
    {
      for(x = 0; x < limit; x++)
       {
         s4[x] = iStdDev(NULL, TimeFrame4, ma_period, ma_shift, ma_method, applied_price, iBarShift(NULL, TimeFrame4, Time[x], false));
       }
    }
   //-----
   string t = Period() + " = Aqua";
   if(TimeFrame2bool) t = t + "\n" + TimeFrame2 + " = Green";
   if(TimeFrame3bool) t = t + "\n" + TimeFrame3 + " = Blue";
   if(TimeFrame4bool) t = t + "\n" + TimeFrame4 + " = Brown";
   Comment(t);
   //=======================================================
   return(0);
 }
//+--------------------------------------------------------------------------+

int deinit()
 {
   Comment("");
 }
Comments