#MTF Stochastic
Download script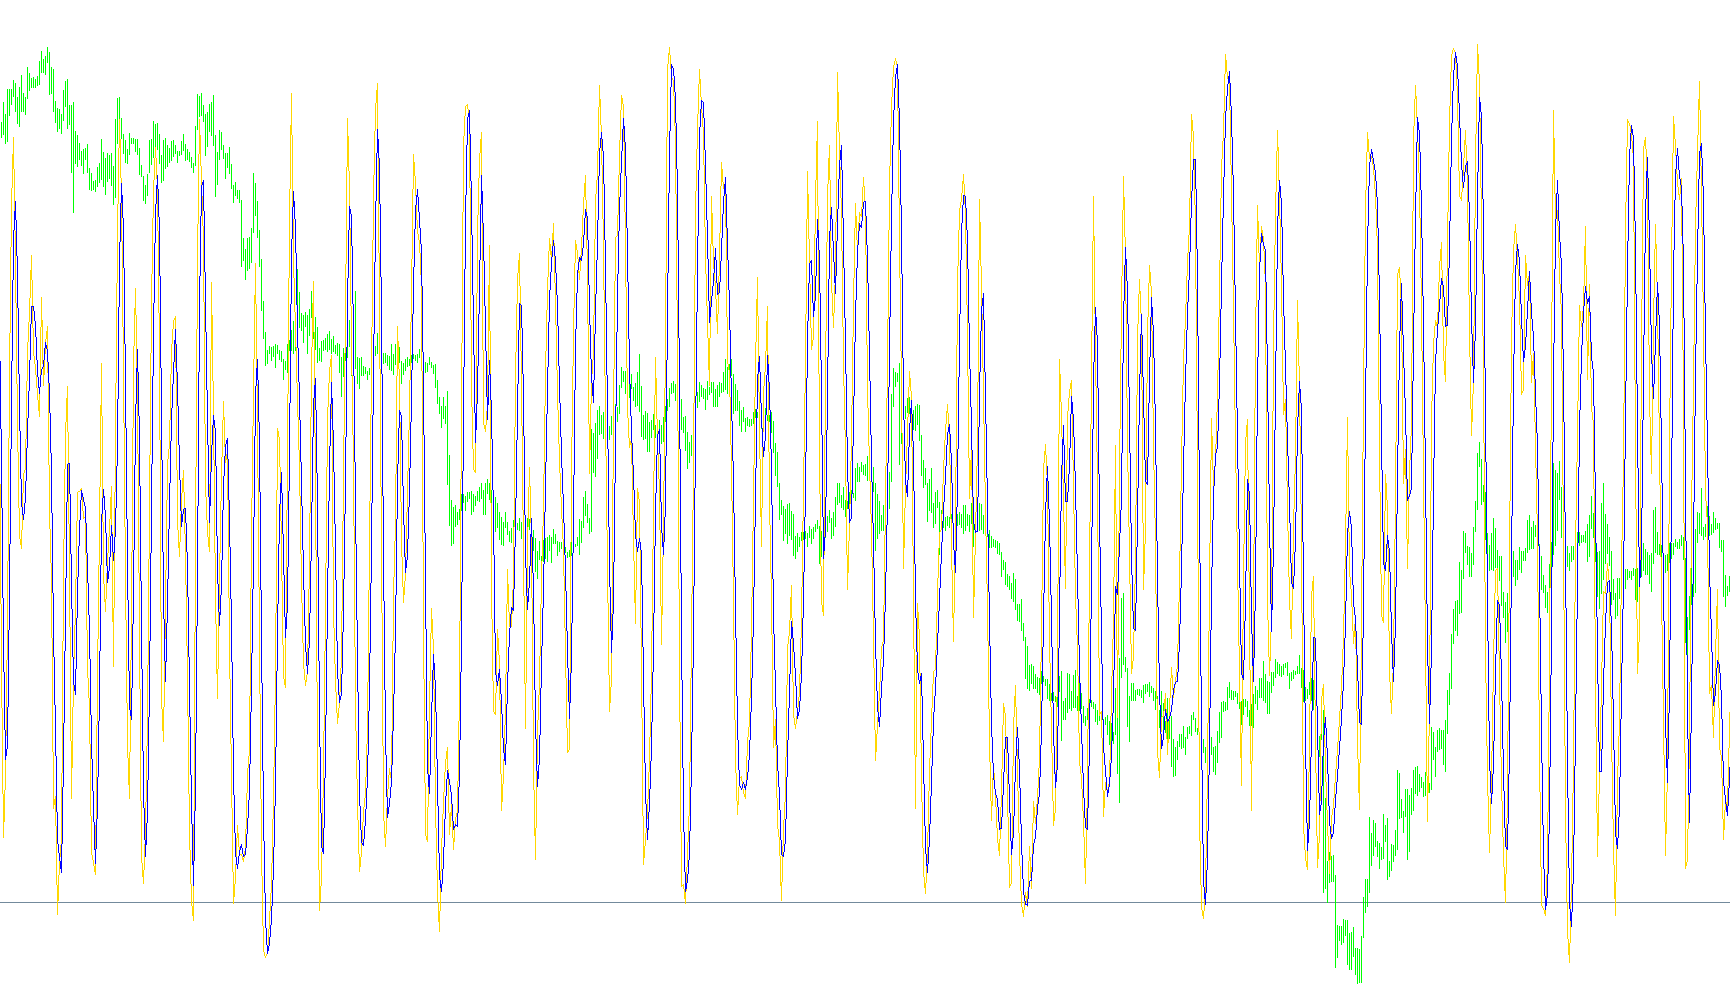
This tool is a specialized technical analysis indicator designed for the MetaTrader 4 platform. It allows traders to view "Stochastic" oscillator data from a different time perspective than the one they are currently viewing on their main chart.
Core Functionality
The primary purpose of this script is Multi-Timeframe (MTF) Analysis. Usually, indicators are locked to the specific timeframe you are looking at (for example, if you are looking at a 1-minute chart, you only see 1-minute data). This tool breaks that limitation by allowing you to overlay data from higher timeframes—such as Daily, Weekly, or Hourly charts—directly onto your current smaller timeframe.
How the Logic Works
To achieve this seamless integration, the script performs three main logical steps:
- Data Retrieval: The script identifies the specific price points and time intervals of a secondary timeframe (the "TimeFrame" parameter) and pulls the Stochastic calculation from that source. It can be customized to look at different periods, smoothing methods, and price types (such as High/Low or Close/Close prices).
- Time Synchronization: Because higher timeframe candles cover many smaller candles on your current chart, the script calculates exactly where each high-level data point aligns with your current view. This ensures that the information shown is geographically accurate on your screen.
- Linear Interpolation: This is the most advanced part of the logic. When pulling data from a higher timeframe (like a Daily candle) onto a lower timeframe (like a 15-minute chart), there is often a "gap" where the data doesn't perfectly align with every single small candle. To solve this, the script uses a mathematical technique called Linear Interpolation. Instead of leaving jagged jumps or flat lines between data points, it calculates smooth transitions to bridge the gaps, providing a fluid and continuous visual representation of the market momentum.
Key Benefits for the User
By using this logic, you can observe "the big picture" without switching back and forth between different windows. It allows you to see how long-term trends are moving while simultaneously watching for short-term entries, ensuring that your trades align with the broader market direction.
//+------------------------------------------------------------------+
//|                                               MTF Stochastic.mq4 |
//|													2007, Christof Risch (iya)	|
//| Stochastic indicator from any timeframe.									|
//+------------------------------------------------------------------+
#property link "http://www.forexfactory.com/showthread.php?t=30109"
#property indicator_separate_window
#property indicator_buffers	2
#property indicator_color1		LightSeaGreen
#property indicator_color2		Red
#property indicator_level1		80
#property indicator_level2		20
#property indicator_maximum	100
#property indicator_minimum	0

//---- input parameters
extern int	TimeFrame	= 0,		// {1=M1, 5=M5, 15=M15, ..., 1440=D1, 10080=W1, 43200=MN1}
				KPeriod		= 5,
				DPeriod		= 3,
				Slowing		= 3,
				MAMethod		= 0,		// {0=SMA, 1=EMA, 2=SMMA, 3=LWMA}
				PriceField	= 0;		// {0=Hi/Low, 1=Close/Close}

//---- indicator buffers
double		Buffer1[],
				Buffer2[];

//+------------------------------------------------------------------+
//| Custom indicator initialization function                         |
//+------------------------------------------------------------------+
int init()
{
//---- indicator lines
	SetIndexBuffer(0,Buffer1);
	SetIndexBuffer(1,Buffer2);
 	SetIndexStyle(0,DRAW_LINE);
	SetIndexStyle(1,DRAW_LINE);

//---- name for DataWindow and indicator subwindow label
	string TimeFrameStr;
	switch(TimeFrame)
	{
		case 1:		TimeFrameStr="Period M1"; break;
		case 5:		TimeFrameStr="Period M5"; break;
		case 15:		TimeFrameStr="Period M15"; break;
		case 30:		TimeFrameStr="Period M30"; break;
		case 60:		TimeFrameStr="Period H1"; break;
		case 240:	TimeFrameStr="Period H4"; break;
		case 1440:	TimeFrameStr="Period D1"; break;
		case 10080:	TimeFrameStr="Period W1"; break;
		case 43200:	TimeFrameStr="Period MN1"; break;
		default:		TimeFrameStr="Current Timeframe";
	}

	IndicatorShortName(TimeFrameStr+" Stoch("+KPeriod+","+DPeriod+","+Slowing+")");
}


//+------------------------------------------------------------------+
//| MTF Stochastic                                                   |
//+------------------------------------------------------------------+
int start()
{
	for(int i = Bars-1-IndicatorCounted(); i >= 0; i--)
	{
		int shift1 = iBarShift(NULL,TimeFrame,Time[i]),
			 time1  = iTime    (NULL,TimeFrame,shift1),
			 shift2 = iBarShift(NULL,0,time1);

		Buffer1[shift2] = iStochastic(NULL,TimeFrame,KPeriod,DPeriod,Slowing,MAMethod,PriceField,0,shift1);
		Buffer2[shift2] = iStochastic(NULL,TimeFrame,KPeriod,DPeriod,Slowing,MAMethod,PriceField,1,shift1);

	//----
	//	linear interpolation for indicators from a higher timeframe
		if(TimeFrame <= Period())
			continue;

	//----
	//	current candle
/*		if(shift1==0)
			for(int n = 1; shift2-n >= 0; n++)
			{
				Buffer1[shift2-n] = Buffer1[shift2];
				Buffer2[shift2-n] = Buffer2[shift2];
			}
*/
	//----
	//	count number of intermediate bars
		for(int n = 1; shift2+n < Bars && Time[shift2+n] > iTime(NULL,TimeFrame,iBarShift(NULL,TimeFrame,Time[shift2+n],true)); n++)
			continue;

	//----
	//	apply interpolation
		double factor = 1.0 / n;
		for(int k = 1; k < n; k++)
		{
			Buffer1[shift2+k] = k*factor*Buffer1[shift2+n] + (1.0-k*factor)*Buffer1[shift2];
			Buffer2[shift2+k] = k*factor*Buffer2[shift2+n] + (1.0-k*factor)*Buffer2[shift2];
		}
	}


	return(0);
}
Comments