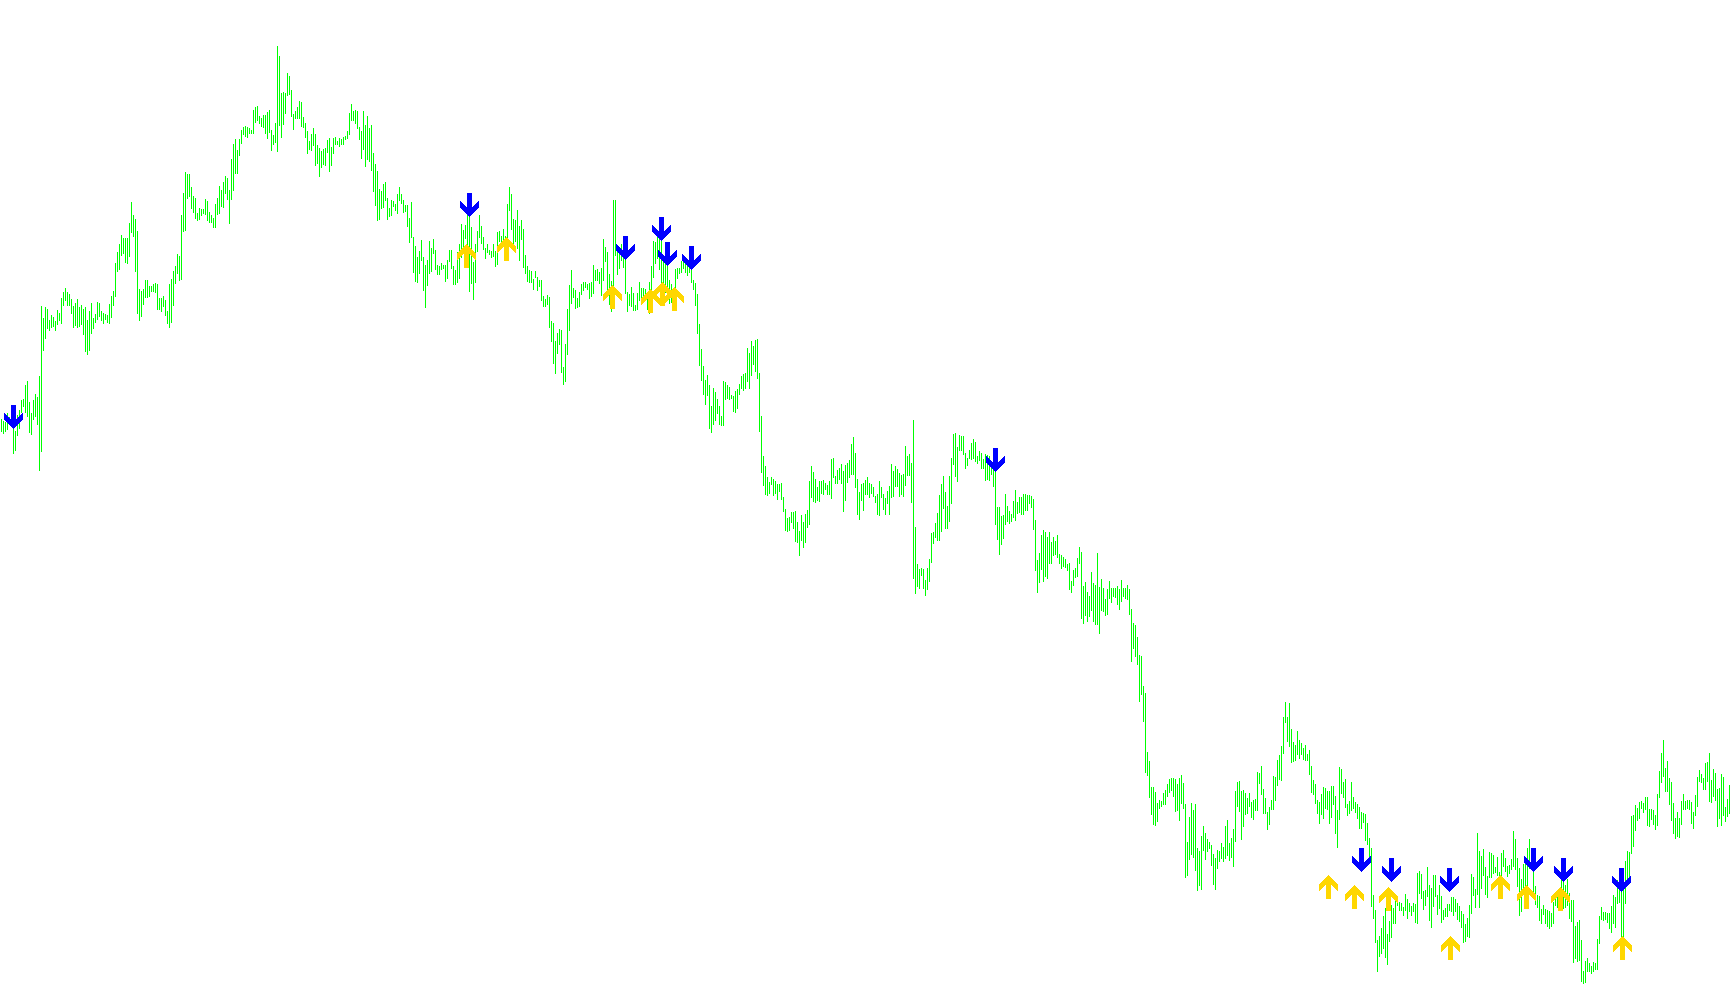
This tool is designed to help traders identify significant shifts in market momentum by monitoring the relationship between price action and two distinct moving averages. By analyzing these trends, the script identifies specific "crossover" moments where the market sentiment may be changing from bullish to bearish, or vice versa.
How the Logic Works
1. Trend Tracking via Moving Averages The script utilizes two different types of Exponential Moving Averages (EMAs). One is set to a faster timeframe (defaulting to 60 periods) and the other to a slower timeframe (defaulting to 100 periods). These averages act as smoothed representations of price history, helping to filter out "market noise" and reveal the underlying trend.
2. Identifying Signal Points The core logic focuses on the moment the market price closes relative to these two moving averages:
- Bullish Signal (Buy): The script looks for a specific instance where the price was previously below both moving averages but has just closed above both of them. When this "breakout" occurs, it signals a potential upward trend.
- Bearish Signal (Sell): Conversely, the script looks for instances where the price was previously above both moving averages but has just closed below both of them. This suggests a downward shift in momentum.
3. Visual and Audible Notifications To ensure traders can react quickly to these changes, the script provides immediate feedback:
- On-Chart Markers: It places visual symbols (arrows) directly on the trading chart at the exact moment a crossover is detected. These markers appear slightly above or below the price candles to make them easy to spot.
- Real-Time Alerts: The script includes an automated alert system. When a new trend shift is confirmed on the most recent completed bar, the platform will trigger a pop-up notification and a sound alert. It is programmed with a "smart" filter to ensure that it only alerts you once per candle, preventing repetitive notifications for the same move.
Summary for the User
Essentially, this script acts as a high-level trend scanner. Instead of forcing you to watch every price tick, it monitors the "big picture" and notifies you only when the price confirms a definitive break through the established moving average boundaries, helping you spot potential entries or exits in a more systematic way.
//+------------------------------------------------------------------+
//|                                                  MVA  Signal.mq4 |
//|                                      Copyright © 2005,mazennafee |
//|                                           mazen.nafee@yahoo.com  |
//+------------------------------------------------------------------+


#property copyright "Copyright © 2005, mazennafee "
#property link      "mazen.nafee@yahoo.com"

#property indicator_chart_window
#property indicator_buffers 2
#property indicator_color1 Green
#property indicator_color2 Red

double CrossUp[];
double CrossDown[];
extern int FasterEMA = 60;
extern int SlowerEMA = 100;
extern bool SoundON=true;
double alertTag;


//+------------------------------------------------------------------+
//| Custom indicator initialization function                         |
//+------------------------------------------------------------------+
int init()
  {
//---- indicators
   SetIndexStyle(0, DRAW_ARROW, EMPTY,3);
   SetIndexArrow(0, 233);
   SetIndexBuffer(0, CrossUp);
   SetIndexStyle(1, DRAW_ARROW, EMPTY,3);
   SetIndexArrow(1, 234);
   SetIndexBuffer(1, CrossDown);
//----
   return(0);
  }
//+------------------------------------------------------------------+
//| Custom indicator deinitialization function                       |
//+------------------------------------------------------------------+
int deinit()
  {
//----

//----
   return(0);
  }
//+------------------------------------------------------------------+
//| Custom indicator iteration function                              |
//+------------------------------------------------------------------+
int start() {
   int limit, i;
   double fasterEMAnow, slowerEMAnow, closepre , closeprePre;

   int counted_bars=IndicatorCounted();
//---- check for possible errors
   if(counted_bars<0) return(-1);
//---- last counted bar will be recounted
   if(counted_bars>0) counted_bars--;

   limit=Bars-counted_bars;

   for(i = 0; i <= limit; i++) {


      fasterEMAnow = iMA(NULL, 0, FasterEMA, 0, MODE_EMA, PRICE_CLOSE, i+1);
      slowerEMAnow = iMA(NULL, 0, SlowerEMA, 0, MODE_EMA, PRICE_CLOSE, i+1);
      closepre     = iClose(NULL,0,i+1);
      closeprePre  = iClose(NULL,0,i+2);

      if ((closepre > fasterEMAnow) && closepre > slowerEMAnow && closeprePre < fasterEMAnow && closeprePre < slowerEMAnow ) {
         CrossUp[i+1] = Low[i+1] - Point*10;
      }
      else if ((closepre < fasterEMAnow) && closepre < slowerEMAnow && closeprePre  > fasterEMAnow && closeprePre > slowerEMAnow) {
          CrossDown[i+1] = High[i+1] + Point*10;
      }
        if (SoundON==true && i==1 && CrossUp[i] > CrossDown[i] && alertTag!=Time[0]){
         Alert("EMA CLOse Trend going Down on ",Symbol()," ",Period());
        alertTag = Time[0];
      }
        if (SoundON==true && i==1 && CrossUp[i] < CrossDown[i] && alertTag!=Time[0]){
       Alert("EMA CLOse Trend going Up on ",Symbol()," ",Period());
        alertTag = Time[0];
        }
  }
   return(0);
}
Comments