#NBS Juice
Download script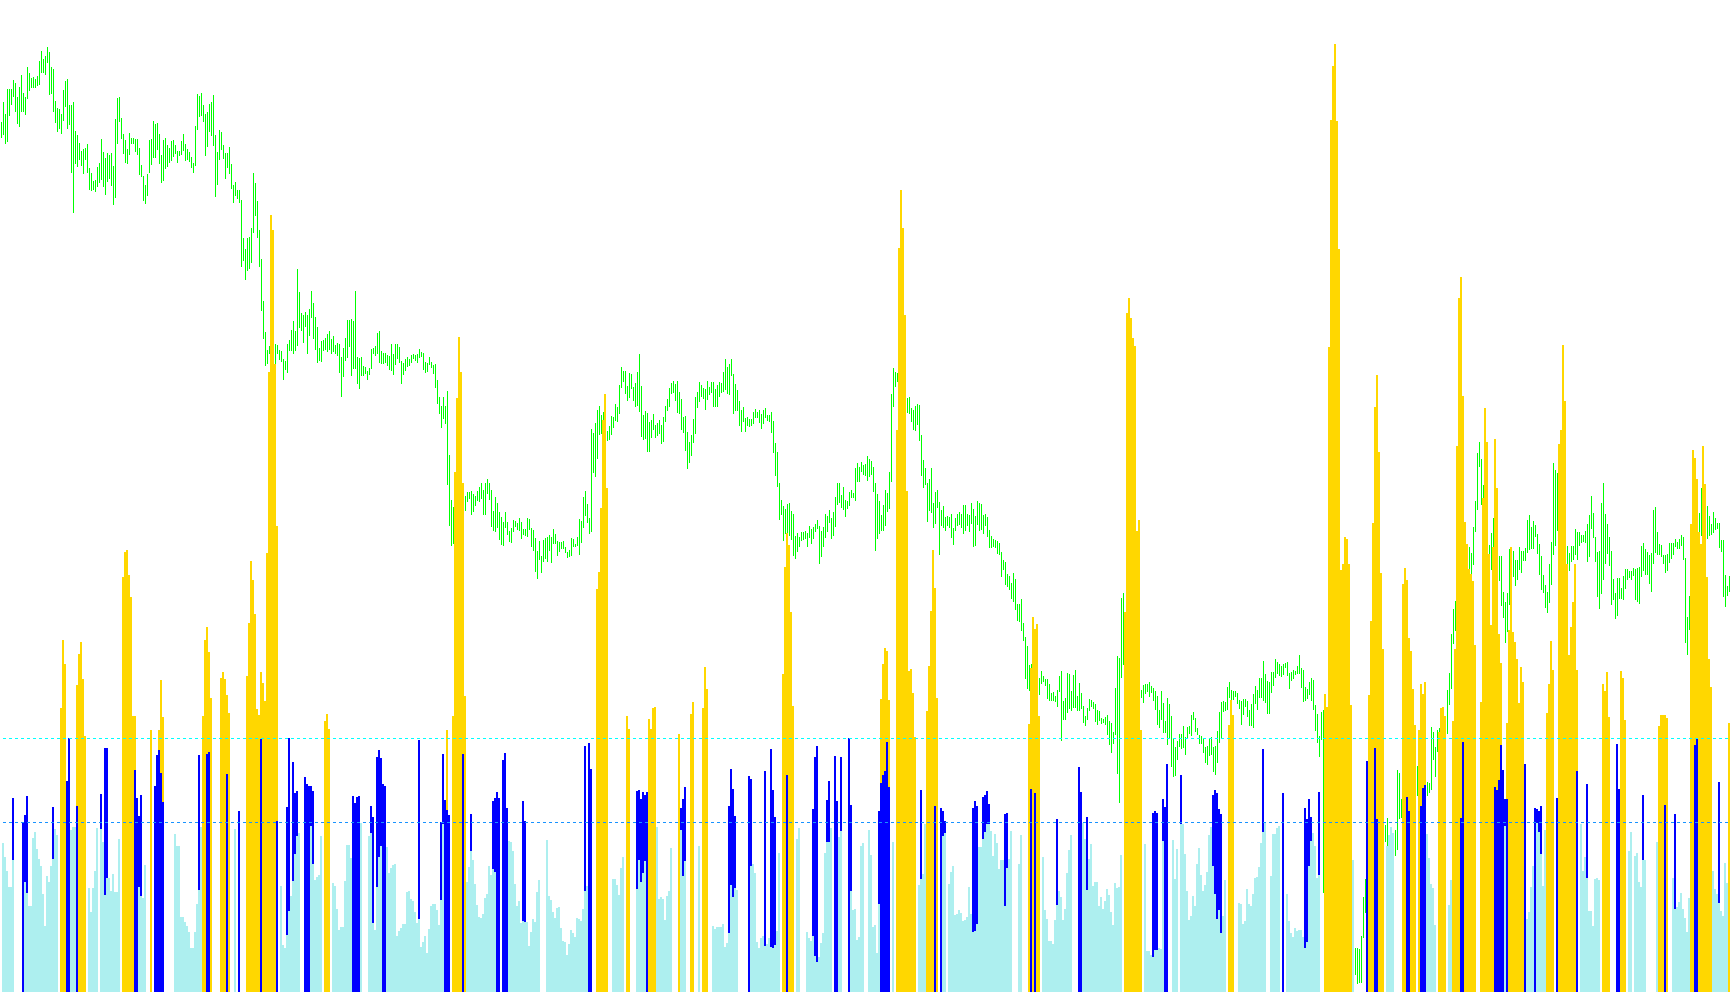
This script functions as a visual market analysis tool designed to help traders assess current market volatility and "momentum" at a glance. Instead of looking at raw price movements, it translates complex statistical data into a simplified, color-coded visual system that categorizes the intensity of the market's activity.
How the Logic Works
The core logic relies on measuring Standard Deviation, which is a mathematical way to determine how much price action is deviating from its average. By analyzing these deviations over a specific timeframe, the script creates a "temperature gauge" for the market.
To make this information useful, the script performs three main steps:
1. Establishing the Baseline The tool looks back at a set number of historical bars to calculate the average market volatility. This creates a "normal" baseline. It essentially asks: "What does typical movement look like for this specific asset right now?"
2. Categorizing the Intensity Once the baseline is established, the script compares current market activity against it in real-time. It divides the market's "juice" (activity level) into three distinct categories based on thresholds:
- High Activity (Good Juice): When the current volatility significantly exceeds the expected average multiplied by a specific factor, it is flagged as high-intensity activity.
- Moderate Activity (SoSo Juice): When the movement is higher than the baseline but doesn't reach the "high" threshold, it is categorized as moderate or "average" activity.
- Low Activity (Bad Juice): When the movement falls below the established baseline, it indicates a period of low energy or stagnation.
3. Visual Representation Rather than providing a wall of numbers, the script translates these calculations into a dedicated window on your trading platform. It uses a combination of histograms and lines to show you:
- The current level of activity (represented by different colors).
- The boundary lines that separate "High," "Moderate," and "Low" zones.
Summary for the User
Think of this tool as a way to filter out the noise of the market. It tells you whether the current price action is over-extended, moving at a steady pace, or becoming sluggish. By observing which color dominates the indicator window, you can quickly identify periods of significant volatility versus periods of calm, helping you decide when the market is providing enough "juice" for your trading strategy.
//+------------------------------------------------------------------+
//|                                                        Juice.mq4 |
//+------------------------------------------------------------------+
#property copyright ""
#property link      ""
//---- indicator settings
#property  indicator_separate_window
#property  indicator_buffers 5
#property  indicator_color1  Olive
#property  indicator_color2  FireBrick
#property  indicator_color3  Orange
#property  indicator_color4  Pink
#property  indicator_color5  Magenta
//---- indicator parameters
extern int    Length=7;
extern double Ks=1.5; //multiplier times avg of stdev over the # of CalcBars
extern int    CalcBars=96; //put zero if want to calculate on all bars
extern int    Advance = 70;

//---- indicator buffers

//---- indicator buffers
double GoodJuice[];
double SoSoJuice[];
double BadJuice[];
double SoSoLine[];
double GoodLine[];

//+------------------------------------------------------------------+
//| Custom indicator initialization function                         |
//+------------------------------------------------------------------+
int init()
  {

//---- drawing settings
   SetIndexStyle(0,DRAW_HISTOGRAM,STYLE_SOLID,2);
   SetIndexStyle(1,DRAW_HISTOGRAM,STYLE_SOLID,2);
   SetIndexStyle(2,DRAW_HISTOGRAM,STYLE_SOLID,2);
   SetIndexStyle(3,DRAW_LINE,STYLE_DOT,1);
   SetIndexStyle(4,DRAW_LINE,STYLE_DOT,1);

//---- indicator buffers mapping
   SetIndexBuffer(0,GoodJuice);
   SetIndexBuffer(1,SoSoJuice);
   SetIndexBuffer(2,BadJuice);
   SetIndexBuffer(3,SoSoLine);
   SetIndexBuffer(4,GoodLine);


//---- name for DataWindow and indicator subwindow label
   IndicatorShortName("Juice mod v1 ("+Length+","+Ks+")");
   SetIndexShift (1, Advance);
//---- initialization done
   SetIndexEmptyValue(0,0);
   SetIndexEmptyValue(1,0);
   SetIndexEmptyValue(2,0);
   SetIndexEmptyValue(3,0);
   SetIndexEmptyValue(4,0);
   return(0);
  }
//+------------------------------------------------------------------+
//| Juice_mod_v1.2                                                   |
//+------------------------------------------------------------------+
int start()
{

   int i;

//---- main loop
   double sum=0;
   if (CalcBars==0) int NBars=Bars-Length; else NBars=CalcBars;
   for(i=1; i<=NBars; i++) sum+=iStdDev(NULL,0,Length,MODE_LWMA,0,PRICE_CLOSE,i);

   double avg=sum/NBars;

   for(i=Bars-Length-1; i>=0; i--)
   {

      double Juice=iStdDev(NULL,0,Length,MODE_LWMA,0,PRICE_CLOSE,i);

         SoSoLine[i]=avg/Point;
         GoodLine[i]=(Ks*avg)/Point;


   if((Juice/Point)>=GoodLine[i]){
         GoodJuice[i]=Juice/Point;
         BadJuice[i]=0;
         SoSoJuice[i]=0;
      }
   if((Juice/Point)<GoodLine[i] && (Juice/Point)>=SoSoLine[i]){
         GoodJuice[i]=0;
         BadJuice[i]=0;
         SoSoJuice[i]=Juice/Point;
      }
    if((Juice/Point)<SoSoLine[i]){
         GoodJuice[i]=0;
         BadJuice[i]=Juice/Point;
         SoSoJuice[i]=0;
      }
   }
//---- done
   return(0);
  }
//+------------------------------------------------------------------+
Comments