nd2_v1
Download script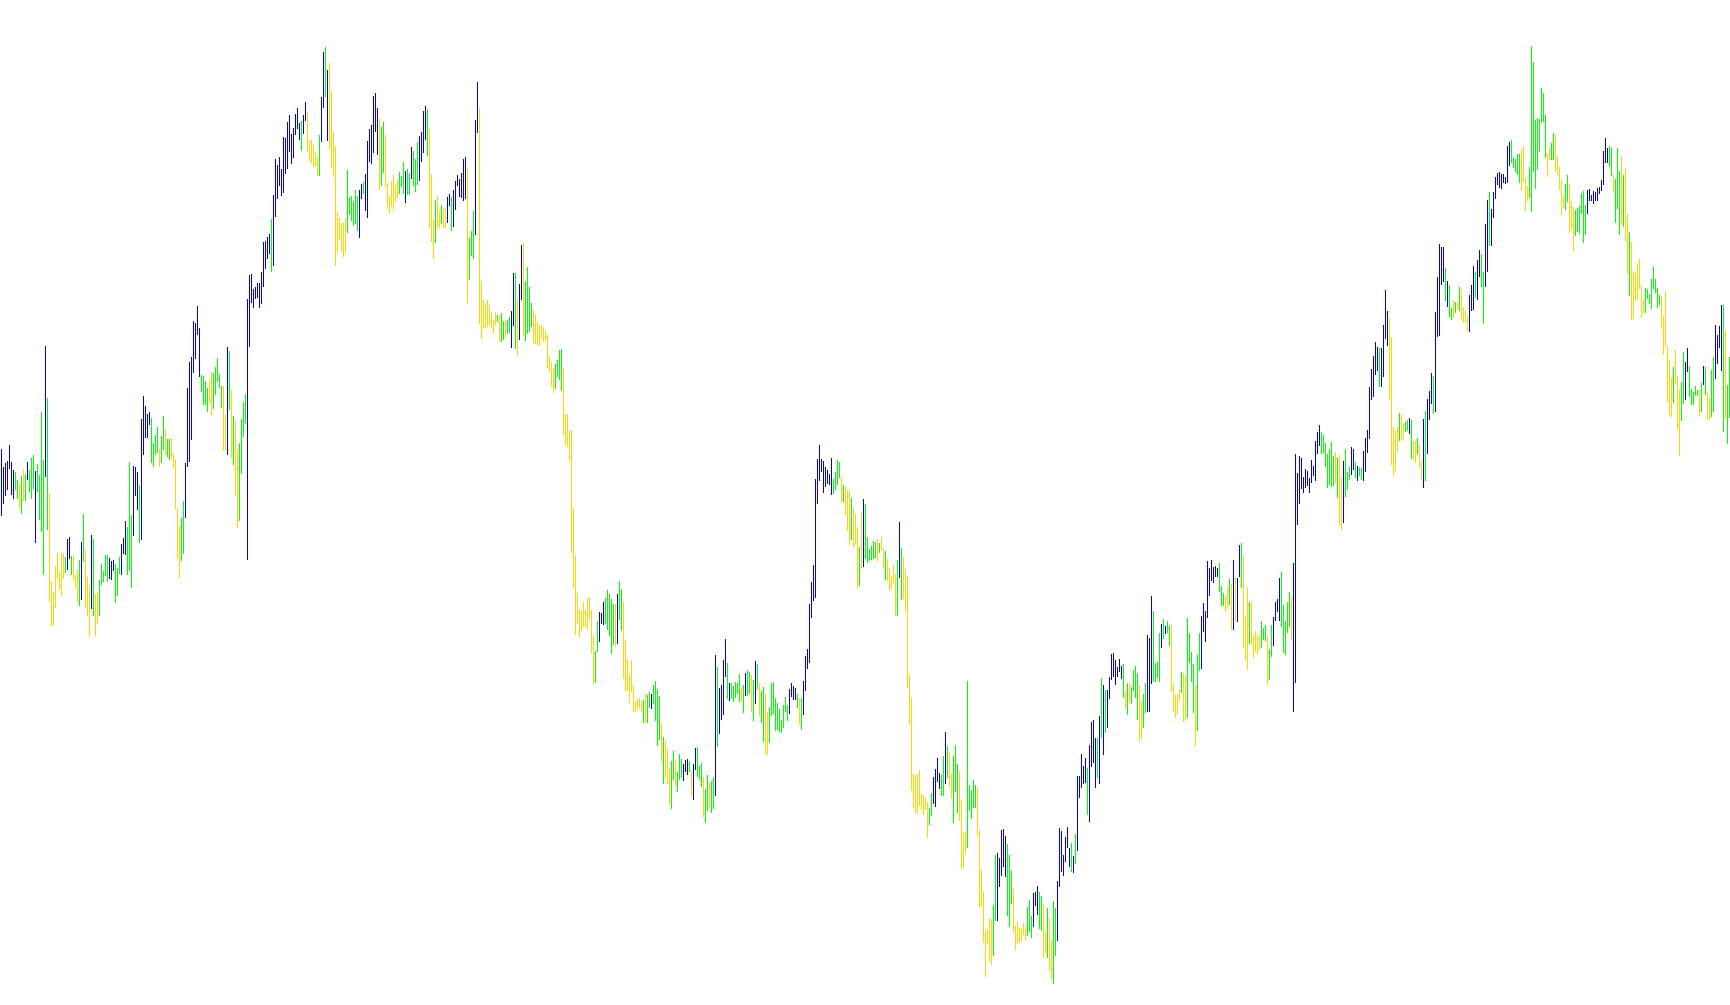
The BrainTrend2 indicator is designed to provide visual clarity on market trends by identifying high-momentum shifts and price extremes. Instead of simply following every small fluctuation in the market, this tool focuses on recognizing significant "moves" to help traders distinguish between standard noise and genuine trend direction.
How the Logic Works
The script operates by analyzing historical price action through three primary layers of calculation:
1. Volatility & Range Analysis The indicator first looks at a rolling window of recent candles to establish a "Normal Range." It calculates the average distance between the highs and lows of these candles. This establishes a baseline for what the market considers a standard movement in the current environment.
2. Momentum Detection (The "True Count") Once it knows the normal range, the script searches for two specific types of aggressive price movements:
- Gap/Jump Detection: It looks for instances where the price opens significantly higher or lower than the previous close (relative to the average range).
- Trend Velocity: It monitors how quickly the price is moving toward a target over several candles.
If either of these conditions is met—meaning the market is moving with enough "force" to be considered significant—the indicator adjusts its sensitivity. Essentially, it "recognizes" when a trend is gaining real strength versus just drifting sideways.
3. Sentiment and Signal Generation The tool then applies a momentum oscillator (similar to a Weighted Percent Rate) to determine the overall sentiment of the market. By combining this sentiment with the force detected in the previous steps, it produces a visual signal:
- Bullish Signal: When the momentum is strong enough, the indicator maps a specific boundary on the chart to signify upward pressure.
- Bearish Signal: When downward pressure dominates, it flips the boundary to signal a prevailing downtrend.
Summary for the User
In simple terms, BrainTrend2 acts as a filter. It evaluates how fast and how far the price is moving compared to recent history. If the move is powerful enough to be considered a "true" trend rather than just random fluctuation, it highlights that direction on your chart. This helps traders stay aligned with the dominant flow of the market while ignoring minor price flickers.
/*-----------------------------+
|			       |
| Shared by www.Aptrafx.com    |
|			       |
+------------------------------*/

//+-----------------------------------------------------------------------+
//|                                                       BrainTrend2.mq4 |
//|                                   Copyright © 2005. Alejandro Galindo |
//|                                                   http://elCactus.com |
//|         ASCTrend1 modified to generate similar signals to BrainTrend1 |
//|           	Author := C0Rpus - big thanks CHANGE2002, STEPAN and SERSH |
//|	                                 Notes := ASCTrend1 3.0 Open Source |
//+-----------------------------------------------------------------------+

#property indicator_chart_window
#property indicator_buffers 2
#property indicator_color1 Red
#property indicator_color2 Blue

//---- input parameters
extern int RISK=3;
extern int CountBars=5000;

//---- buffers
double Buffer1[];
double Buffer2[];

//+------------------------------------------------------------------+
//| Custom indicator initialization function                         |
//+------------------------------------------------------------------+
int init()
  {
//---- indicator line
   IndicatorBuffers(2);
   SetIndexStyle(0,DRAW_HISTOGRAM,0,1);
   SetIndexStyle(1,DRAW_HISTOGRAM,0,1);
   SetIndexBuffer(0,Buffer1);
   SetIndexBuffer(1,Buffer2);

//----
   return(0);
  }
//+------------------------------------------------------------------+
//| ASCTrend1                                                  |
//+------------------------------------------------------------------+
int start()
  {
   if (CountBars>=Bars) CountBars=Bars;
   SetIndexDrawBegin(0,Bars-CountBars+11+1);
   SetIndexDrawBegin(1,Bars-CountBars+11+1);
   int i,shift,counted_bars=IndicatorCounted();
   int Counter,i1,value10,value11;
   double value1,x1,x2;
   double value2,value3;
   double TrueCount,Range,AvgRange,MRO1,MRO2;

   value10=3+RISK*2;
   x1=67+RISK;
   x2=33-RISK;
   value11=value10;
//----
   if(Bars<=value11+1) return(0);
//---- initial zero
   if(counted_bars<value11+1)
   {
      for(i=1;i<=0;i++) Buffer1[CountBars-i]=0.0;
      for(i=1;i<=0;i++) Buffer2[CountBars-i]=0.0;
   }
//----
   shift=CountBars-11-1;
   while(shift>=0)
     {

   Counter=shift;
	Range=0.0;
	AvgRange=0.0;
	for (Counter=shift; Counter<=shift+9; Counter++) AvgRange=AvgRange+MathAbs(High[Counter]-Low[Counter]);

	Range=AvgRange/10;
	Counter=shift;
	TrueCount=0;
	while (Counter<shift+9 && TrueCount<1)
		{if (MathAbs(Open[Counter]-Close[Counter+1])>=Range*2.0) TrueCount=TrueCount+1;
		Counter=Counter+1;
		}
	if (TrueCount>=1) {MRO1=Counter;} else {MRO1=-1;}
	Counter=shift;
	TrueCount=0;
	while (Counter<shift+6 && TrueCount<1)
		{if (MathAbs(Close[Counter+3]-Close[Counter])>=Range*4.6) TrueCount=TrueCount+1;
		Counter=Counter+1;
		}
	if (TrueCount>=1) {MRO2=Counter;} else {MRO2=-1;}
	if (MRO1>-1) {value11=3;} else {value11=value10;}
	if (MRO2>-1) {value11=4;} else {value11=value10;}
	value2=100-MathAbs(iWPR(NULL,0,value11,shift)); // PercentR(value11=9)
   Buffer1[shift]=0;
	Buffer2[shift]=0;
	if (value2>x1)
		{
		Buffer1[shift]=Low[shift]; Buffer2[shift]=High[shift];
		}
	if (value2<x2)
		{
		Buffer1[shift]=High[shift]; Buffer2[shift]=Low[shift];
		}

      shift--;
     }

   return(0);
  }
//+------------------------------------------------------------------+
Comments