newMACD
Download script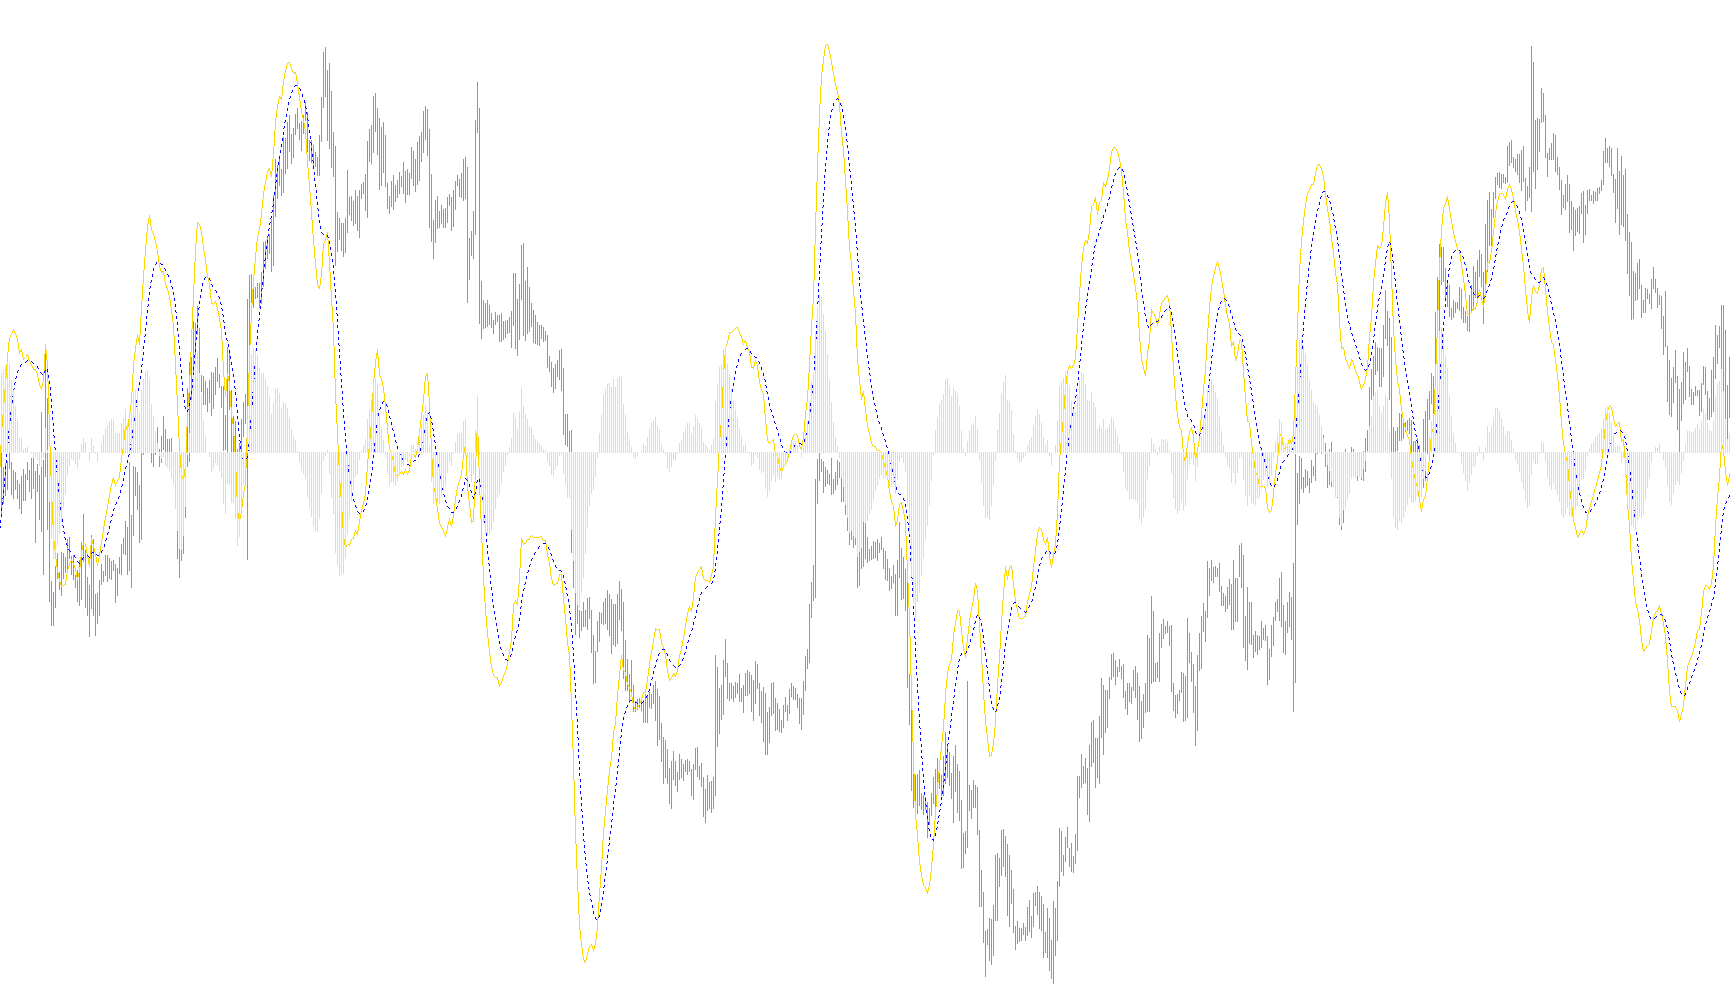
This tool is designed as a technical analysis indicator for the MetaTrader platform, specifically crafted to provide a precise visual representation of market momentum. It functions by calculating the relationship between different price moving averages to help traders identify trends and potential turning points in price action.
Core Logic and Methodology
The script operates through a three-layered calculation process that translates raw price data into three distinct visual components:
1. The MACD Line (Trend Momentum) The foundation of the tool is the calculation of the "MACD Line." To achieve this, the script looks at two different Exponential Moving Averages (EMA):
- A Fast EMA (which reacts quickly to recent price changes).
- A Slow EMA (which tracks the broader, long-term trend).
By subtracting the Slow EMA from the Fast EMA, the script identifies the "gap" between short-term and long-term momentum. If the Fast line is significantly above the Slow line, it suggests upward momentum; if it falls below, it suggests downward pressure.
2. The Signal Line (The Smoothing Filter) To prevent "market noise" from creating false signals, the script calculates a Signal Line. This is essentially a smoothed version of the MACD Line itself. It uses a specific weighted formula to blend the current momentum with previous data points. This creates a secondary line that moves more gradually than the primary MACD Line, acting as a baseline for identifying significant shifts in trend direction.
3. The Histogram (The Variance Tracker) Finally, the script generates a Histogram. This is a visual representation of the distance between the MACD Line and the Signal Line.
- When the Histogram bars are tall and moving in one direction, it indicates strong, sustained momentum.
- When the bars begin to shrink or cross toward the zero midline, it suggests that the current momentum is weakening and a trend reversal may be approaching.
User Experience and Visual Output
The tool organizes these calculations into a dedicated sub-window separate from the main price chart. It provides three distinct visual cues:
- A solid line representing the core MACD value.
- A dotted line representing the Signal average.
- A vertical histogram that allows for a quick, at-a-glance assessment of market strength.
By utilizing these three layers, the script allows users to see not just where the price is going, but how fast it is moving and whether that speed is beginning to tire out.
//+------------------------------------------------------------------+
//|                                                      newMACD.mq4 |
//|                                Copyright © 2005, David W. Thomas |
//|                                           mailto:davidwt@usa.net |
//+------------------------------------------------------------------+
// This is the correct computation and display of MACD.
#property copyright "Copyright © 2005, David W. Thomas"
#property link      "mailto:davidwt@usa.net"

#property indicator_separate_window
#property indicator_buffers 3
#property indicator_color1 Blue
#property indicator_color2 Red
#property indicator_color3 Green
//---- input parameters
extern int FastMAPeriod = 12;
extern int SlowMAPeriod = 26;
extern int SignalMAPeriod = 9;
//---- buffers
double MACDLineBuffer[];
double SignalLineBuffer[];
double HistogramBuffer[];
//---- variables
double alpha = 0;
double alpha_1 = 0;

//+------------------------------------------------------------------+
//| Custom indicator initialization function                         |
//+------------------------------------------------------------------+
int init()
{
   IndicatorDigits(Digits + 1);
   //---- indicators
   SetIndexStyle(0, DRAW_LINE);
   SetIndexBuffer(0, MACDLineBuffer);
   SetIndexDrawBegin(0, SlowMAPeriod);
   SetIndexStyle(1, DRAW_LINE, STYLE_DOT);
   SetIndexBuffer(1, SignalLineBuffer);
   SetIndexDrawBegin(1, SlowMAPeriod + SignalMAPeriod);
   SetIndexStyle(2, DRAW_HISTOGRAM);
   SetIndexBuffer(2, HistogramBuffer);
   SetIndexDrawBegin(2, SlowMAPeriod + SignalMAPeriod);
   //---- name for DataWindow and indicator subwindow label
   IndicatorShortName("NMACD(" + FastMAPeriod+"," + SlowMAPeriod + "," + SignalMAPeriod + ")");
   SetIndexLabel(0, "NMACD");
   SetIndexLabel(1, "Signal");
   SetIndexLabel(2, "Histogr");
   //----
	  alpha = 2.0 / (SignalMAPeriod + 1.0);
	  alpha_1 = 1.0 - alpha;
   //----
   return(0);
}
//+------------------------------------------------------------------+
//| Custor indicator deinitialization function                       |
//+------------------------------------------------------------------+
int deinit()
  {
   //----
   return(0);
  }
//+------------------------------------------------------------------+
//| Custom indicator iteration function                              |
//+------------------------------------------------------------------+
int start()
  {
   int limit;
   int counted_bars = IndicatorCounted();
   //---- check for possible errors
   if(counted_bars < 0)
       return(-1);
   //---- last counted bar will be recounted
   if(counted_bars > 0)
       counted_bars--;
   limit = Bars - counted_bars;
//----
   for(int i = limit; i >= 0; i--)
     {
       MACDLineBuffer[i] = iMA(NULL, 0, FastMAPeriod, 0, MODE_EMA, PRICE_CLOSE, i) -
                           iMA(NULL, 0, SlowMAPeriod, 0, MODE_EMA, PRICE_CLOSE, i);
       SignalLineBuffer[i] = alpha*MACDLineBuffer[i] + alpha_1*SignalLineBuffer[i+1];
       HistogramBuffer[i] = MACDLineBuffer[i] - SignalLineBuffer[i];
     }
//----
   return(0);
  }
//+------------------------------------------------------------------+
Comments