NRTR_ATR_STOP_v1
Download script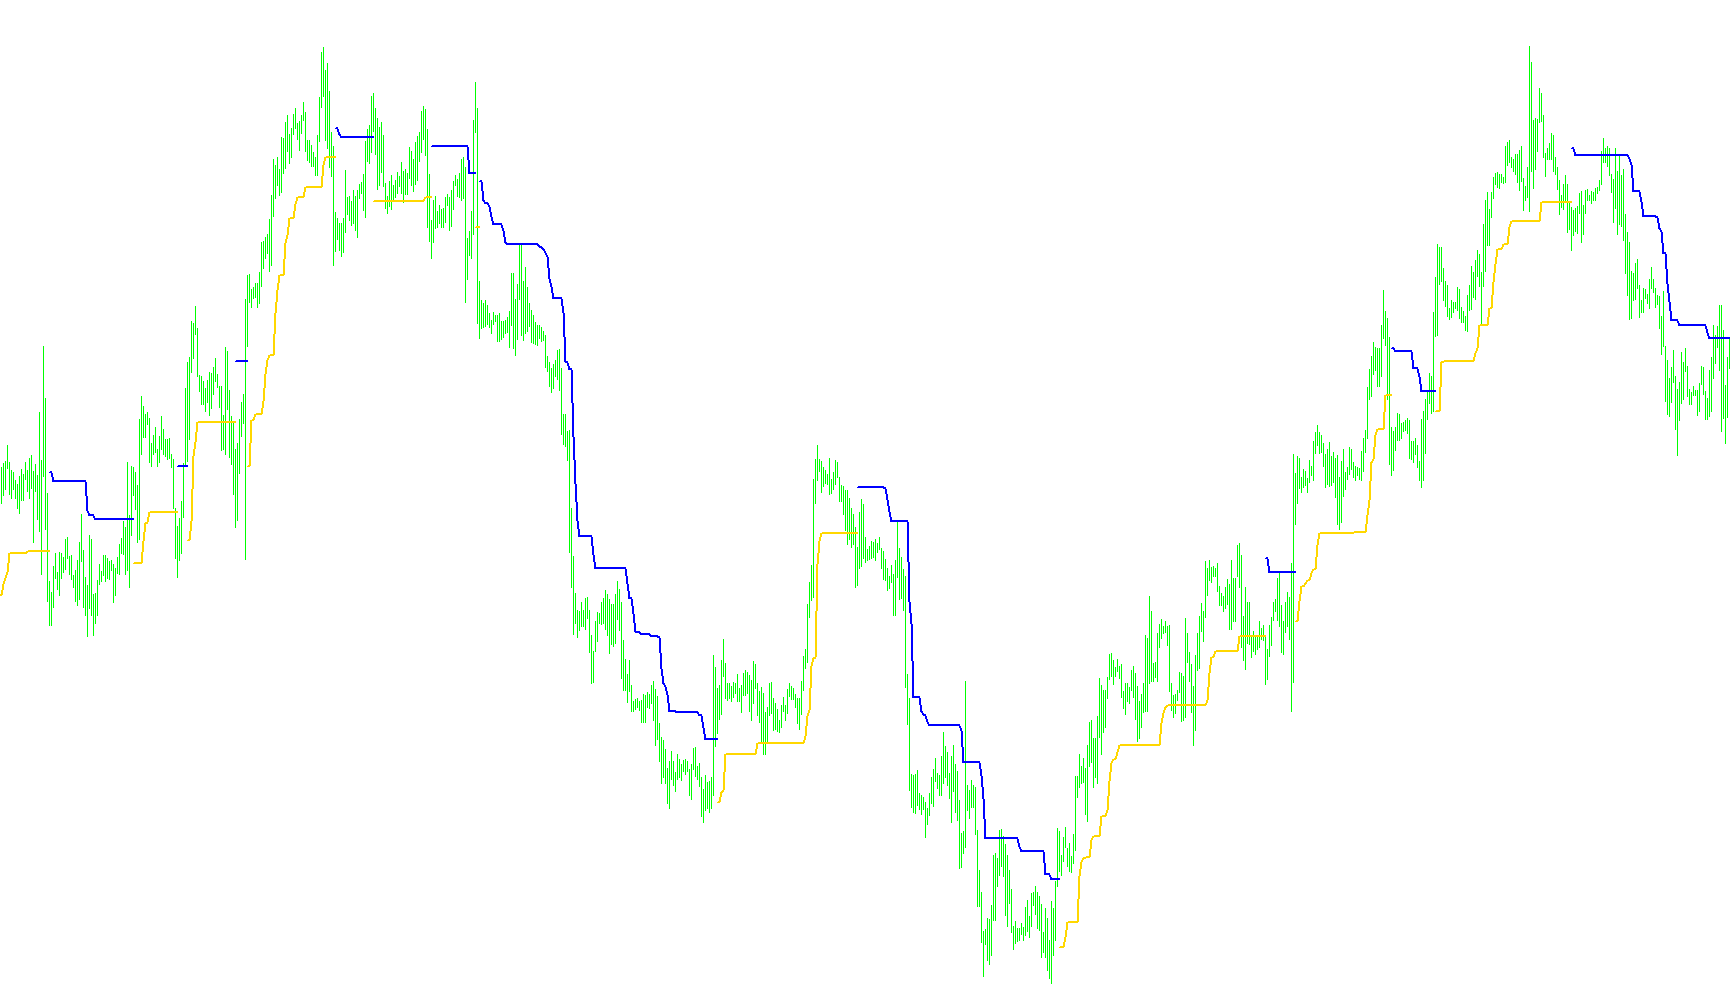
This script is designed to work as a visual trading tool that automatically plots dynamic support and resistance levels on your chart. It uses a combination of market volatility and price action trends to identify significant "floor" and "ceiling" zones, helping traders visualize where the price might react or reverse.
How the Logic Works
1. Volatility Measurement The script relies heavily on a mathematical concept called ATR (Average True Range). This measures how much an asset typically moves during a specific period. By using this, the tool ensures that the distance between the support and resistance lines adjusts automatically—widening during times of high market turbulence and tightening when the market is calm.
2. Determining the Initial Trend When you first apply the script, it performs a "look-back" analysis on historical data. It compares current volatility against the average volatility of the past several bars.
- If the volatility is currently lower than its recent average, the script assumes a stable base and identifies an initial "Up" position (Support).
- If the volatility is higher than its average, it identifies a "Down" position (Resistance).
3. Dynamic Price Tracking Once the initial direction is established, the script begins to track price movement in real-time:
- Mode Switching: The indicator constantly watches for "breakouts." If the price closes significantly above an existing resistance line, the script flips its logic to "Up" mode and establishes a new support level. Conversely, if the price drops significantly below a support line, it flips to "Down" mode and establishes a new resistance level.
- Level Maintenance: When the market is moving in a steady direction (the current "Mode"), the script attempts to hold the existing line. It will only move the line forward if the price pushes far enough away from the previous level to justify a new one.
4. Visual Output The result is two distinct lines on your chart:
- Blue Line: Represents the active support level (the "floor").
- Red Line: Represents the active resistance level (the "ceiling").
Summary for the User
Essentially, this tool acts like a moving safety net. It measures how "wild" the market is currently behaving and places lines at calculated distances from the price. If the price breaks through these lines with enough force, the tool recognizes the new trend and redraws the safety net to reflect the updated market structure.
//+------------------------------------------------------------------+
//|                                                NRTR_ATR_STOP.mq4 |
//|                      Copyright © 2006, MetaQuotes Software Corp. |
//|                                        http://www.metaquotes.net |
//+------------------------------------------------------------------+
#property copyright "Copyright © 2006, MetaQuotes Software Corp."
#property link      "http://www.metaquotes.net"

#property indicator_chart_window
#property indicator_buffers  2
#property indicator_color1 Blue
#property indicator_color2 Red
//----
extern int ATR = 20;
extern int Coeficient = 2;
//----
double Up[], Dn[];
string MODE;
bool first;
//+------------------------------------------------------------------+
//| Custom indicator initialization function                         |
//+------------------------------------------------------------------+
int init()
  {
   SetIndexBuffer(0, Up);
   SetIndexStyle (0, DRAW_LINE, 0, 2);
   SetIndexEmptyValue(0, 0.0);
   SetIndexLabel (0, "Up");
//----
   SetIndexBuffer(1, Dn);
   SetIndexStyle (1, DRAW_LINE, 0, 2);
   SetIndexEmptyValue(1, 0.0);
   SetIndexLabel (1, "Dn");
//----
   first=true;
//----
   return(0);
  }
//+------------------------------------------------------------------+
//| Custom indicator deinitialization function                       |
//+------------------------------------------------------------------+
int deinit()
  {
   first = true;
   return(0);
  }
//+------------------------------------------------------------------+
//| Custom indicator iteration function                              |
//+------------------------------------------------------------------+
int start()
  {
   int i, limit;
   double REZ, md;
   limit = Bars - ATR - 1;
//----
   if(first)
     {
       md = 0;
       for(i = 0; i < limit; i++)
           md += iATR(NULL, 0, ATR, i);
       REZ = Coeficient*iATR(NULL, 0, ATR, limit);
       if(iATR(NULL, 0, ATR, limit) < md / limit)
         {
           Up[limit+1] = Low[limit+1] - REZ;
           MODE = "UP";
         }
       if(iATR(NULL, 0, ATR, limit) > md / limit)
         {
           Dn[limit+1] = High[limit+1] + REZ;
           MODE = "DN";
         }
       first = false;
     }
//----
   for(i = limit - 1; i >= 0; i--)
     {
       Dn[i] = 0;
       Up[i] = 0;
       REZ = Coeficient*iATR(NULL, 0, ATR, i);
       //----
       if(MODE == "DN" &&  Low[i+1] > Dn[i+1])
         {
           Up[i+1] = Low[i+1] - REZ;
           MODE = "UP";
         }
       //----
       if(MODE == "UP" && High[i+1] < Up[i+1])
         {
           Dn[i+1] = High[i+1] + REZ;
           MODE = "DN";
         }
       //----
       if(MODE=="UP")
         {
           if(Low[i+1] > Up[i+1] + REZ)
             {
               Up[i] = Low[i+1] - REZ;
               Dn[i] = 0;
             }
		         else
		           {
		             Up[i] = Up[i+1];
		             Dn[i] = 0;
		           }
		       }
       //----
       if(MODE=="DN")
         {
     	     if(High[i+1] < Dn[i+1] - REZ)
     	       {
     	         Dn[i] = High[i+1] + REZ;
     	         Up[i] = 0;
     	       }
	          else
	            {
	              Dn[i] = Dn[i+1];
	              Up[i] = 0;
	            }
	        }
     }
   return(0);
  }
//+------------------------------------------------------------------+
Comments