NRTR_color_line
Download script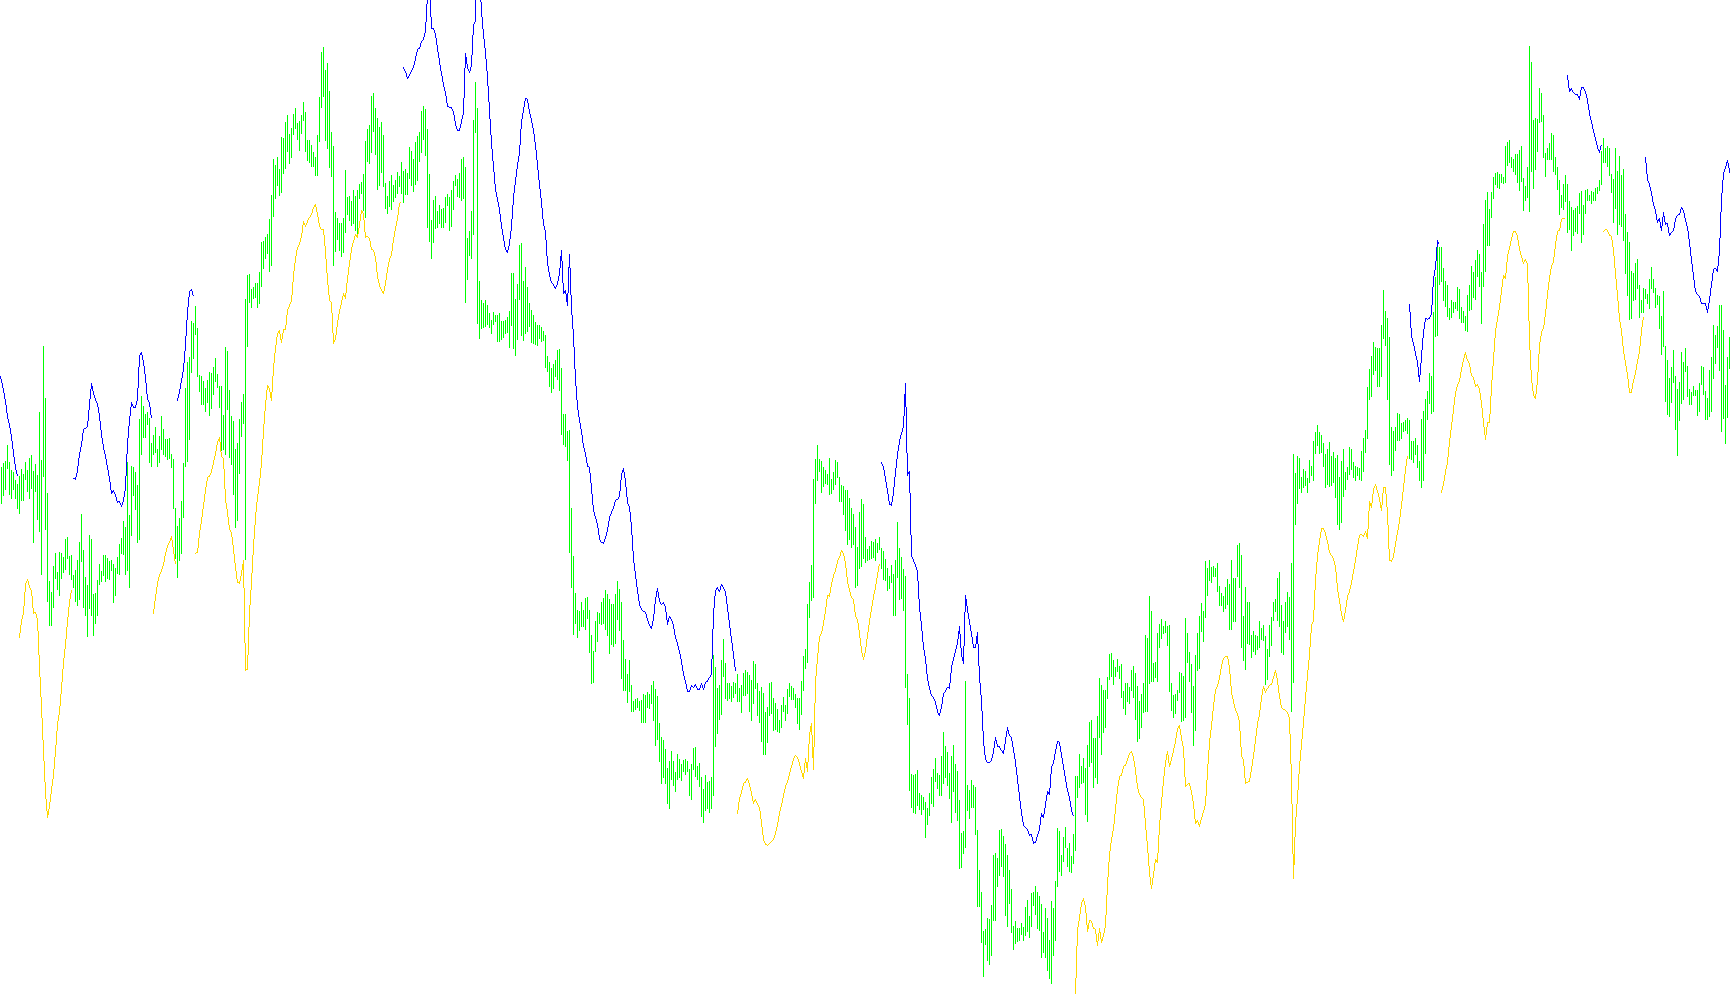
This tool is designed to help traders visualize market trends by identifying the "ceiling" and "floor" of price movements. It works by dynamically calculating a trailing boundary that adjusts based on current market volatility, allowing it to adapt to both calm and turbulent trading environments.
Core Logic Overview
The script analyzes historical price data to determine whether the market is currently in an uptrend or a downtrend. Instead of using a fixed number for these boundaries, it uses a sophisticated calculation to measure how much the price moves on average. By multiplying this volatility measurement by a specific coefficient, the tool creates a "buffer zone."
How It Works Step-by-Step
- Trend Identification: The script looks back at a specific starting point in history to establish the initial direction of the market.
- Volatility Tracking: It constantly monitors the range between the high and low prices of recent candles. This allows the tool to "stretch" its boundaries during high-activity periods and "tighten" them during quieter markets.
- Dynamic Boundaries:
- In an Uptrend, the script tracks a lower boundary (the floor). If the price drops significantly below this floor—beyond the calculated volatility buffer—the tool recognizes a trend reversal and switches its focus.
- In a Downtrend, it tracks an upper boundary (the ceiling). If the price spikes above this ceiling by more than the allowed buffer, it signals that the market has flipped direction.
- Continuous Updating: As new price data arrives, the script constantly updates the "Extremum" (the highest or lowest point reached during the current trend) to ensure the boundaries are always reacting to the most recent significant price action.
Visual Representation
The tool communicates this information through two distinct lines on your chart:
- Blue Line: Represents the active floor during an upward trend, helping you visualize the support level the market is maintaining.
- Red Line: Represents the active ceiling during a downward trend, highlighting the resistance level where the price is being contained.
By providing these moving boundaries, the script helps traders stay on the right side of the prevailing momentum, offering a clearer picture of where the "edge" of the current market move lies.
/*-----------------------------+
|			       |
| Shared by www.Aptrafx.com    |
|			       |
+------------------------------*/

//+------------------------------------------------------------------+
//|                                              NRTR_color_line.mq4 |
//+------------------------------------------------------------------+

#property indicator_chart_window
#property indicator_buffers 2
#property indicator_color1 Blue
#property indicator_color2 Red
//---- input parameters
extern int ATRPeriod=14;
extern double Coefficient=4.0;
extern int StartBar=1000;

//---- buffers
double value1[];
double value2[];

bool TrendUP;
double Extremum,TR,ATR,Values[100],ChannelWidth;
int J,Head,Weight,Curr;

int init() {

//---- indicator line
   IndicatorBuffers(2);
   SetIndexStyle(0,DRAW_LINE);
   SetIndexArrow(0,167);
   SetIndexEmptyValue(0,0);
   SetIndexEmptyValue(1,0);
   SetIndexStyle(1,DRAW_LINE);
   SetIndexArrow(1,167);
   SetIndexBuffer(0,value1);
   SetIndexBuffer(1,value2);
   return(0);
}

int start() {
   int Shift;

   if (Close[StartBar-2] > Close[StartBar-1]) TrendUP = true;
   else TrendUP = false;
   Extremum = Close[ StartBar - 2 ];

   for (Shift = StartBar - 3; Shift>=0; Shift--) {
	   TR = High[Shift] - Low[Shift];
	   if ( MathAbs( High[ Shift ] - Close[ Shift + 1 ]) > TR ) TR = MathAbs( High[ Shift ] - Close[ Shift + 1 ]);
	   if ( MathAbs( Low[ Shift ] - Close[ Shift + 1 ]) > TR )  TR = MathAbs( Low[ Shift ] - Close[ Shift + 1 ]);
	   if (Shift == StartBar - 3)
		   for (J = 0; J<ATRPeriod; J++) {
			   Values[J] = TR;
		   }
	   Values[ Head ] = TR;
	   ATR = 0;
	   Weight = ATRPeriod;
	   Curr = Head;
	   for (J = 0; J<ATRPeriod; J++) {
		   ATR += Values[ Curr ] * Weight;
		   Weight -= 1;
		   Curr -= 1;
		   if ( Curr == -1 ) Curr = ATRPeriod - 1;
	   }
	   ATR = ( 2.0 * ATR ) / ( ATRPeriod * ( ATRPeriod + 1.0 ));
	   Head += 1;
	   if (Head == ATRPeriod) Head = 0;
	   ChannelWidth = Coefficient * ATR;
	   if (TrendUP && ( Low[ Shift ] < ( Extremum - ChannelWidth ) ) )  {
		   TrendUP = false;
		   Extremum = High[ Shift ];
	   }
	   if ( !TrendUP && ( High[ Shift ] > ( Extremum + ChannelWidth) ) ) {
		   TrendUP = true;
		   Extremum = Low[ Shift ];
	   }

	   if ( TrendUP && ( Low[Shift] > Extremum ) ) Extremum = Low[ Shift ];
	   if ( !TrendUP && ( High[ Shift ] < Extremum ) ) Extremum = High[ Shift ];

	   if (TrendUP) {
		   value1[Shift]=Extremum - ChannelWidth;
		   value2[Shift]=0;
	   } else {
		   value1[Shift]=0;
		   value2[Shift]=Extremum + ChannelWidth;
	   }
	}
}
Comments