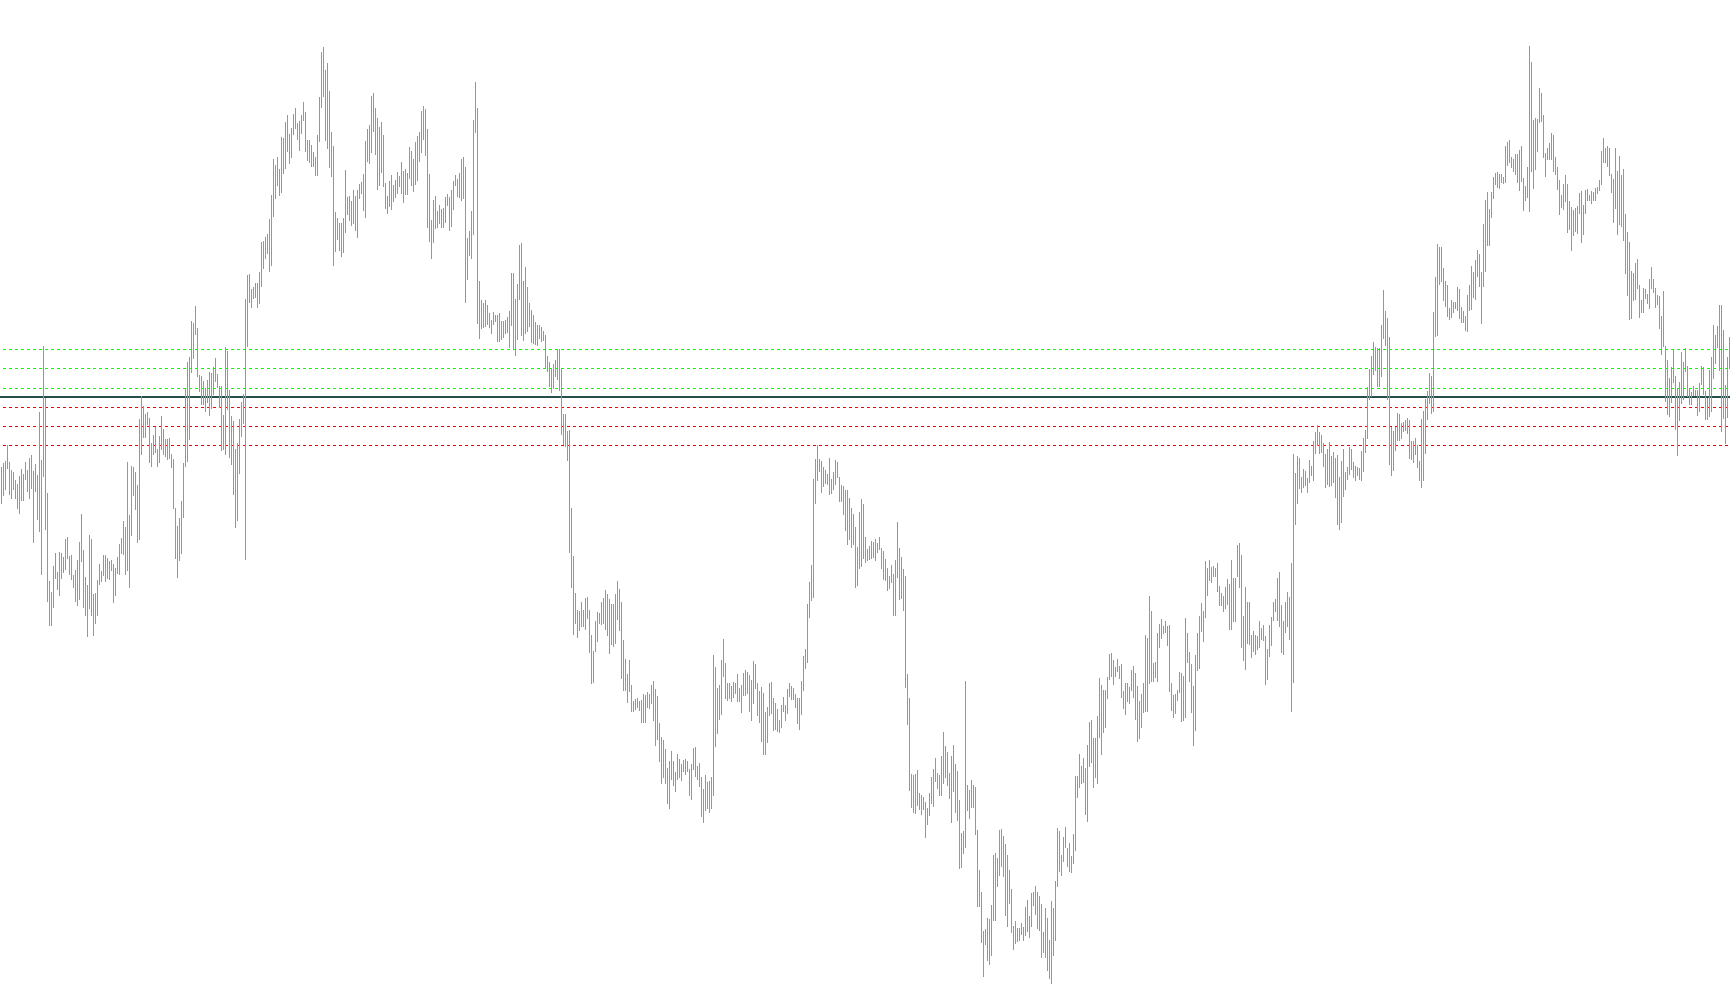
This technical tool is designed to provide traders with a clear visual framework for identifying key price levels on a trading chart. It works by automatically calculating and drawing specific horizontal lines based on either "Pivot" points or the current daily opening price.
Core Functionality
The script identifies a central reference point—the "Open Pivot"—and then projects three levels of support and resistance above and below that center. These levels act as visual boundaries to help traders see where the market might encounter significant pressure or stability.
How the Logic Works
-
The Reference Point (Center): The tool starts by determining its base price. Depending on your settings, it calculates this in one of two ways:
- Pivot Mode: It takes the average of the previous day's high, low, and closing prices to establish a balanced center point.
- Open Price Mode: If Pivot mode is off, it simply uses the current day's opening price as the base.
-
Support and Resistance Projection: Once the center point is established, the script automatically calculates three distinct levels on each side:
- Upper Levels: These are projected above the center price to identify potential overhead resistance.
- Lower Levels: These are projected below the center price to identify potential support zones.
-
Visual Customization: The logic allows for high flexibility in how these lines appear on your screen:
- Visibility: You can choose whether the lines span across the entire chart or are restricted to specific areas.
- Styling: The script provides options to customize the thickness, style (such as dashed or solid), and colors of both the upper and lower levels, allowing for a personalized dashboard.
- Extension: You can choose whether the lines project infinitely into the future or remain fixed within a specific range.
User Impact
Instead of manually drawing lines to guess where the market might turn, this script provides an instant, automated map of daily price zones. It creates a structured "grid" that helps traders stay organized and identify potential entry or exit areas based on the day's primary price structure.
//+------------------------------------------------------------------+
//|                                        Open_Pivot_PlusLevels.mq4 |
//|                                 Copyright © 2008,cjatradingtools |
//+------------------------------------------------------------------+
#property copyright  "Open_Pivot,By cja"
#property indicator_chart_window
extern bool Use_Pivot        = false;
extern bool Show_Full_Lines  = true;
extern int UpperLEVEL3       = 125;
extern int UpperLEVEL2       = 75;
extern int UpperLEVEL1       = 25;
extern color Upper_Color     = Lime;
extern int LowerLEVEL1       = 25;
extern int LowerLEVEL2       = 75;
extern int LowerLEVEL3       = 125;
extern color Lower_Color     = Red;
extern int Line_width        = 1;
extern int Line_style        = 2;
extern bool Extend_Lines     = true;

extern color Open_Pivot_Color = DarkSlateGray;
extern int   Open_Pivot_width = 2;

#define PP1 "PP1"
#define UPPER "UPPER"
#define LOWER "LOWER"
#define UPPER1 "UPPER1"
#define LOWER1 "LOWER1"
#define UPPER2 "UPPER2"
#define LOWER2 "LOWER2"

double x;
int trend;
//+------------------------------------------------------------------+
//| Custom indicator initialization function                         |
//+------------------------------------------------------------------+
int init()
  {
//---- indicators
IndicatorShortName("Open_Pivot_PlusLevels");
//----
   return(0);
  }
//+------------------------------------------------------------------+
//| Custom indicator deinitialization function                       |
//+------------------------------------------------------------------+
int deinit()
  {
//----
   ObjectDelete(PP1);
   ObjectDelete(UPPER); ObjectDelete(LOWER);
   ObjectDelete(UPPER1); ObjectDelete(LOWER1);
   ObjectDelete(UPPER2); ObjectDelete(LOWER2);

   DeleteLevel();
//----
   return(0);
  }
//+------------------------------------------------------------------+
//| Custom indicator iteration function                              |
//+------------------------------------------------------------------+
int start()
  {
   int counted_bars= IndicatorCounted();
    x = Period();
       if(x > 240) return(-1);

  if(Show_Full_Lines){trend = OBJ_HLINE;}else{trend=OBJ_TREND;}
//----
   CreatePVT();
}

void CreateLevel(string Line, double start, double end,double w, double s,color clr)
  {
   ObjectCreate(Line, trend, 0, iTime(NULL,1440,0), start, Time[0], end);
   ObjectSet(Line, OBJPROP_COLOR, clr);
   ObjectSet(Line,OBJPROP_WIDTH,w);
   ObjectSet(Line,OBJPROP_STYLE,s);
   ObjectSet(Line,OBJPROP_RAY,Extend_Lines);
   ObjectSet(Line,OBJPROP_BACK,true);
     }
        void DeleteLevel()
   {
   ObjectDelete(PP1);
   ObjectDelete(UPPER); ObjectDelete(LOWER);
   ObjectDelete(UPPER1); ObjectDelete(LOWER1);
   ObjectDelete(UPPER2); ObjectDelete(LOWER2);
   }
   void CreatePVT()
   {

     DeleteLevel();

    if(Use_Pivot){
    double P = (iHigh(NULL,1440,1) + iLow(NULL,1440,1) + iClose(NULL,1440,1)) / 3;}
    else{P = iOpen(NULL,1440,0);}

    double UP = P+ UpperLEVEL1*Point;
    double DN = P- LowerLEVEL1*Point;
    double UP1 = P+ UpperLEVEL2*Point;
    double DN1 = P- LowerLEVEL2*Point;
    double UP2 = P+ UpperLEVEL3*Point;
    double DN2 = P- LowerLEVEL3*Point;


    CreateLevel(PP1,P,P,Open_Pivot_width,0,Open_Pivot_Color);
    CreateLevel(UPPER,UP,UP,Line_width,Line_style, Upper_Color );
    CreateLevel(LOWER,DN,DN,Line_width,Line_style, Lower_Color );
    CreateLevel(UPPER1,UP1,UP1,Line_width,Line_style, Upper_Color );
    CreateLevel(LOWER1,DN1,DN1,Line_width,Line_style, Lower_Color );
    CreateLevel(UPPER2,UP2,UP2,Line_width,Line_style, Upper_Color );
    CreateLevel(LOWER2,DN2,DN2,Line_width,Line_style, Lower_Color );


//----
   return(0);
  }
//+------------------------------------------------------------------+
Comments