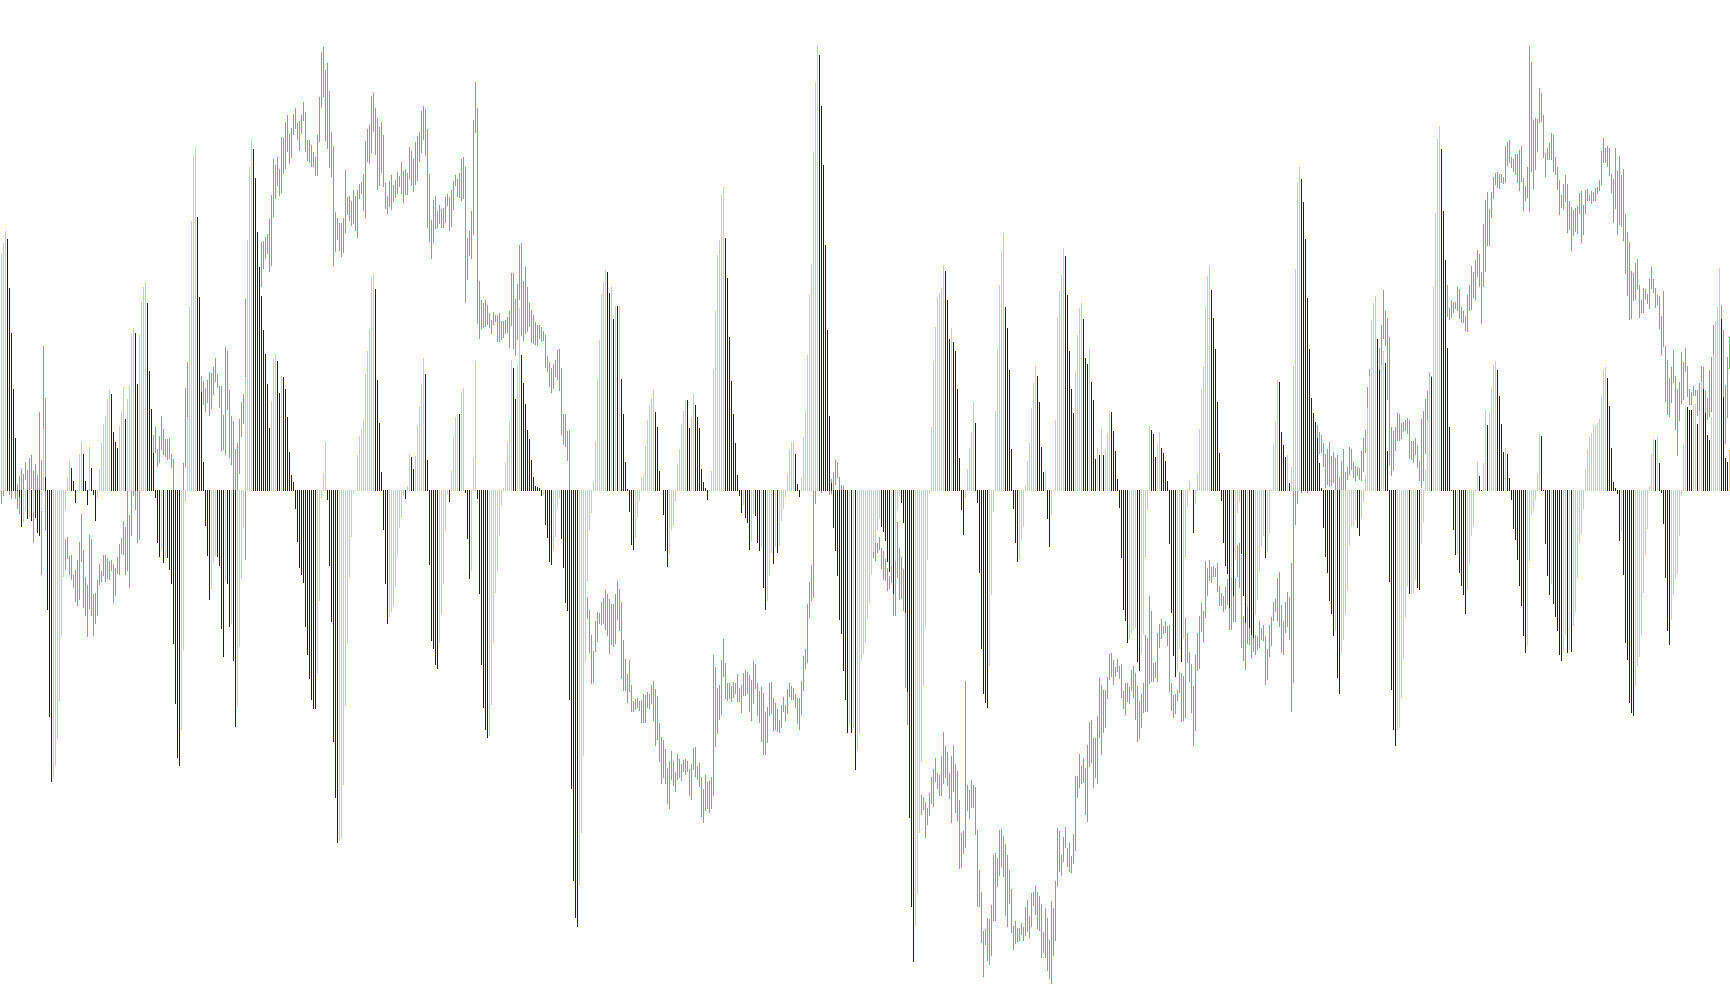
This script is a custom technical analysis tool designed for the MetaTrader 4 platform. It functions as an advanced momentum oscillator that combines several mathematical layers to help traders identify trend directions and potential entry or exit points in the financial markets.
Core Logic and Calculation
The indicator operates by layering three distinct types of moving averages to filter out "market noise" and reveal underlying trends:
- The Foundation (MACD): First, the script calculates a standard MACD (Moving Average Convergence Divergence). It does this by finding the difference between two exponential moving averages—one fast and one slow. This determines the basic momentum of the price.
- The Signal Line: The script then takes that MACD value and applies a third moving average to it. This creates a "signal line," which acts as a smoothed reference point for the primary momentum.
- The Final Oscillator (OsMA): The final result (the OsMA) is generated by subtracting the Signal Line from the MACD. This specific calculation highlights the velocity of price movement, making it easier to spot when momentum is accelerating or slowing down.
Visual Representation
To make this data easy to read on a chart, the script translates these calculations into a visual histogram:
- Trend Direction: The script compares the current value against the previous value. If the momentum is increasing, it highlights the histogram in one color (SteelBlue); if it is decreasing, it switches to another (Red).
- Separate Window: Rather than cluttering the main price chart, this indicator lives in its own dedicated sub-window at the bottom of the screen.
Automated Alerts and Notifications
The script is designed to be proactive rather than reactive. It monitors the data in real-time and triggers specific actions based on three key behaviors:
- Histogram Color Changes: The tool detects when the momentum shifts from "strengthening" to "weakening" (or vice versa) and can trigger a sound alert or send an email notification.
- Zero-Line Crossings: A critical moment in trend analysis is when the oscillator crosses the "Zero Line." The script monitors for these transitions, signifying a potential shift from bearish (negative) to bullish (positive) territory—or the opposite.
- Real-time Updates: When these key events occur, the script can automatically display a text comment on your chart and provide audible alerts or email summaries containing the symbol name, time of occurrence, and timeframe.
User Customization
The logic is fully flexible, allowing users to adjust the "sensitivity" of the indicator by changing the periods of the Fast EMA, Slow EMA, and Signal SMA. This allows a trader to choose between a highly responsive tool that reacts quickly to small price changes or a smoother tool that focuses on long-term trends.
//+------------------------------------------------------------------+
//|                                                         OsMA.mq4 |
//|                      Copyright © 2004, MetaQuotes Software Corp. |
//|                                       http://www.metaquotes.net/ |
//|                                    Copyright © 2006, Robert Hill |
//|                                    Copyright © 2008, Linuxser    |
//+------------------------------------------------------------------+
#property  copyright "Copyright © 2006, Robert Hill"
#property  copyright "Copyright © 2008, Linuxser and Forex-TSD"
#property  link      "http://www.metaquotes.net/"
//---- indicator settings
#property  indicator_separate_window
#property  indicator_buffers 2
#property  indicator_color1  SteelBlue
#property  indicator_color2  Red

//---- indicator parameters
extern bool SoundON=true;
extern bool EmailON=false;
extern bool HistogramAlarm=true;
extern bool ZeroLineAlarm=true;
extern int FastEMA=12;
extern int SlowEMA=26;
extern int SignalSMA=9;

//---- indicator buffers
double     OsmaBuffer[];
double     MacdBuffer[];
double     SignalBuffer[];
double HistogramBufferUp[];
double HistogramBufferDown[];
bool HistAboveZero = false;
bool HistBelowZero = false;
bool MACDAboveZero = false;
bool MACDBelowZero = false;

//+------------------------------------------------------------------+
//| Custom indicator initialization function                         |
//+------------------------------------------------------------------+
int init()
  {
//---- 2 additional buffers are used for counting.
   IndicatorBuffers(5);
//---- drawing settings
   SetIndexDrawBegin(0,SignalSMA);
   SetIndexStyle(0,DRAW_HISTOGRAM,STYLE_SOLID);
   SetIndexBuffer(0,HistogramBufferUp);
   SetIndexStyle(1,DRAW_HISTOGRAM,STYLE_SOLID);
   SetIndexBuffer(1,HistogramBufferDown);
   IndicatorDigits(Digits+2);
//---- 3 indicator buffers mapping
   SetIndexBuffer(2,OsmaBuffer);
   SetIndexBuffer(3,MacdBuffer);
   SetIndexBuffer(4,SignalBuffer);
   SetIndexBuffer(0,HistogramBufferUp);
   SetIndexBuffer(1,HistogramBufferDown);

//---- name for DataWindow and indicator subwindow label
   IndicatorShortName("OsMA("+FastEMA+","+SlowEMA+","+SignalSMA+")");
//---- initialization done
   return(0);
  }
//+------------------------------------------------------------------+
//| Moving Average of Oscillator                                     |
//+------------------------------------------------------------------+
int start()
  {

   double current, prev;
   int limit;
   int counted_bars=IndicatorCounted();
//---- last counted bar will be recounted
   if(counted_bars>0) counted_bars--;
   limit=Bars-counted_bars;
//---- macd counted in the 1-st additional buffer
   for(int i=0; i<limit; i++)
      MacdBuffer[i]=iMA(NULL,0,FastEMA,0,MODE_EMA,PRICE_CLOSE,i)-iMA(NULL,0,SlowEMA,0,MODE_EMA,PRICE_CLOSE,i);
//---- signal line counted in the 2-nd additional buffer
   for(i=0; i<limit; i++)
      SignalBuffer[i]=iMAOnArray(MacdBuffer,Bars,SignalSMA,0,MODE_SMA,i);
//---- main loop
   for(i=0; i<limit; i++)
      OsmaBuffer[i]=MacdBuffer[i]-SignalBuffer[i];

   for(i=0; i<limit; i++)
   {
      HistogramBufferUp[i] = 0;
      HistogramBufferDown[i] = 0;
      current = MacdBuffer[i] - SignalBuffer[i];
      prev = MacdBuffer[i+1] - SignalBuffer[i+1];
      if (current > prev)
      {
        HistogramBufferUp[i] = current;
        HistogramBufferDown[i] = 0.0;
      }
      else
      {
        HistogramBufferDown[i] = current;
        HistogramBufferUp[i] = 0.0;
      }

      if (MACDAboveZero) Comment ("\nOSMA: M", Period()," Trend has changed to UP");
      if (MACDBelowZero) Comment ("\nOSMA: M", Period()," Trend has changed to DOWN");

      if (i == 1)
      {
// Check for Histogram Change Color
        if  (HistogramAlarm==true)
        {
        if (HistogramBufferUp[i] > HistogramBufferDown[i + 1])
        {
// Cross up
         if (HistAboveZero == false)
         {
           HistAboveZero=true;
           HistBelowZero=false;
           if (SoundON) Alert(Symbol(),"  M",Period()," OSMA is Positive"); //"\n Time=",TimeToStr(CurTime(),TIME_DATE)," ",TimeHour(CurTime()),":",TimeMinute(CurTime()),"\n Symbol=",Symbol()," Period=",Period());
           if (EmailON) SendMail("OSMA is Positive", "MACD Crossed up, Date="+TimeToStr(CurTime(),TIME_DATE)+" "+TimeHour(CurTime())+":"+TimeMinute(CurTime())+" Symbol="+Symbol()+" Period="+Period());
         }
        }
        else if (HistogramBufferDown[i] <  HistogramBufferUp[i + 1] > 0)
        {
// Cross down
         if (HistBelowZero == false)
         {
          HistBelowZero=true;
          HistAboveZero=false;
          if (SoundON) Alert(Symbol(),"  M",Period()," OSMA is Negative"); //"\n Time=",TimeToStr(CurTime(),TIME_DATE)," ",TimeHour(CurTime()),":",TimeMinute(CurTime()),"\n Symbol=",Symbol()," Period=",Period());
          if (EmailON) SendMail("OSMA is Negative","MACD Crossed Down, Date="+TimeToStr(CurTime(),TIME_DATE)+" "+TimeHour(CurTime())+":"+TimeMinute(CurTime())+" Symbol="+Symbol()+" Period="+Period());
         }
        }
        }
// Check for MACD Signal line crossing 0 line
        if (ZeroLineAlarm==true)
        {
        if (OsmaBuffer[i] > 0 && OsmaBuffer[i + 1] < 0)
        {
// Cross up
         if (MACDAboveZero == false)
         {
           MACDAboveZero=true;
           MACDBelowZero=false;
           if (SoundON) Alert(Symbol(),"  M",Period()," OSMA Histogram is Above 0"); //"\n Time=",TimeToStr(CurTime(),TIME_DATE)," ",TimeHour(CurTime()),":",TimeMinute(CurTime()),"\n Symbol=",Symbol()," Period=",Period());
           if (EmailON) SendMail("Histogram is Above Zero Line", "OSMA Crossed up, Date="+TimeToStr(CurTime(),TIME_DATE)+" "+TimeHour(CurTime())+":"+TimeMinute(CurTime())+" Symbol="+Symbol()+" Period="+Period());
         }
        }
        else if (OsmaBuffer[i] < 0 && OsmaBuffer[i + 1] > 0)
        {
// Cross down
         if (MACDBelowZero == false)
         {
          MACDBelowZero=true;
          MACDAboveZero=false;
          if (SoundON) Alert(Symbol(),"  M",Period()," OSMA Histogram is Below 0");//"\n Date=",TimeToStr(CurTime(),TIME_DATE)," ",TimeHour(CurTime()),":",TimeMinute(CurTime()),"\n Symbol=",Symbol()," Period=",Period());
          if (EmailON) SendMail("Histogram is Below Zero Line","OSMA Crossed Down, Date="+TimeToStr(CurTime(),TIME_DATE)+" "+TimeHour(CurTime())+":"+TimeMinute(CurTime())+" Symbol="+Symbol()+" Period="+Period());
         }
        }
      }
    }
   }

//---- done
   return(0);
  }
Comments