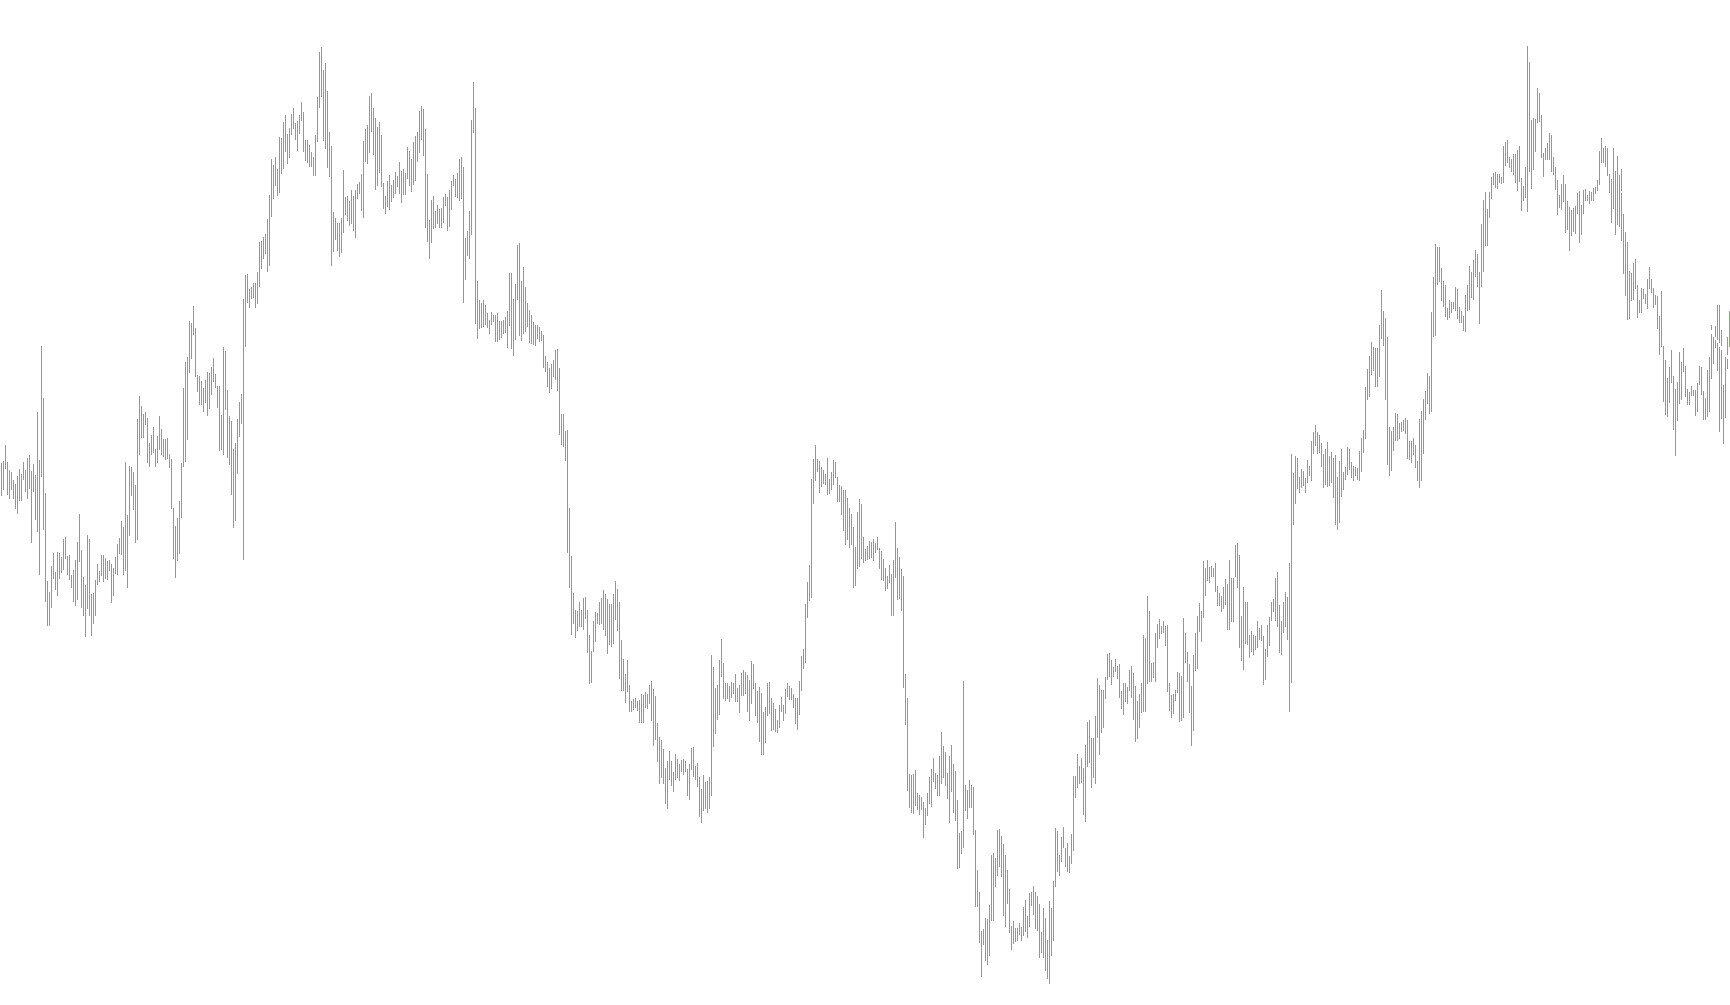
The Palka indicator is a specialized technical analysis tool designed to provide visual insights into price action by highlighting specific relationships between current market prices and past data points. Instead of showing standard moving averages or volume indicators, this script focuses on identifying price correlations over a fixed historical window.
Core Operational Logic
The primary function of this indicator relies on a "look-back" mechanism. It establishes a reference point based on a user-defined period (set by default to 55 bars). The logic functions as follows:
- Price Mapping: The script tracks the closing prices of the seven most recent candles on your chart. Simultaneously, it identifies the closing prices of the candles that occurred exactly one "period" ago (e.g., if the period is 55, it looks at the price from 56 bars ago).
- Dual-Point Tracking: By capturing these two sets of data points—the current immediate prices and the corresponding historical prices—the indicator creates a mathematical bridge between where the price is now and where it was in the past.
- Average Calculation: The script calculates a specialized average by combining these seven pairs of data points. This results in a distinct value that represents a weighted snapshot of the market's movement relative to its historical cycle.
Visual Representation
On the trading chart, the indicator processes this information into a specific visual format:
- Hidden Data Layers: The script manages eight different data buffers. Seven of these are used to calculate the underlying math but are kept hidden from your view to keep the chart clean.
- Dynamic Sectioning: The final result is rendered as a "Section" line. This allows the user to see a clear, synthesized representation of the calculated average without cluttering the screen with multiple overlapping lines.
Summary for Traders
In essence, the Palka indicator acts as a smoothing mechanism that compares current price action against a specific historical timeframe. By calculating the average difference between "now" and "then," it helps traders visualize price stability or shifts relative to a recurring cycle, providing a unique perspective on market momentum.
//+------------------------------------------------------------------+
//|                                                        Palka.mq4 |
//+------------------------------------------------------------------+
#property copyright "© Maloma"

#property indicator_chart_window
#property indicator_buffers 8
#property indicator_color1 Red
#property indicator_color2 Orange
#property indicator_color3 Yellow
#property indicator_color4 Green
#property indicator_color5 Aqua
#property indicator_color6 Blue
#property indicator_color7 Violet
#property indicator_color8 White

extern int PPeriod=55;

double LineBuffer0[];
double LineBuffer1[];
double LineBuffer2[];
double LineBuffer3[];
double LineBuffer4[];
double LineBuffer5[];
double LineBuffer6[];
double LineBuffer7[];

int init()
  {
    SetIndexBuffer(0,LineBuffer0);
    SetIndexBuffer(1,LineBuffer1);
    SetIndexBuffer(2,LineBuffer2);
    SetIndexBuffer(3,LineBuffer3);
    SetIndexBuffer(4,LineBuffer4);
    SetIndexBuffer(5,LineBuffer5);
    SetIndexBuffer(6,LineBuffer6);
    SetIndexBuffer(7,LineBuffer7);

    SetIndexStyle(0,DRAW_NONE,EMPTY,1);
    SetIndexStyle(1,DRAW_NONE,EMPTY,1);
    SetIndexStyle(2,DRAW_NONE,EMPTY,1);
    SetIndexStyle(3,DRAW_NONE,EMPTY,1);
    SetIndexStyle(4,DRAW_NONE,EMPTY,1);
    SetIndexStyle(5,DRAW_NONE,EMPTY,1);
    SetIndexStyle(6,DRAW_NONE,EMPTY,1);
    SetIndexStyle(7,DRAW_SECTION,EMPTY,2);

    SetIndexEmptyValue(0,0.0);
    SetIndexEmptyValue(1,0.0);
    SetIndexEmptyValue(2,0.0);
    SetIndexEmptyValue(3,0.0);
    SetIndexEmptyValue(4,0.0);
    SetIndexEmptyValue(5,0.0);
    SetIndexEmptyValue(6,0.0);
    SetIndexEmptyValue(7,0.0);

    SetIndexLabel(0,"Line0");
    SetIndexLabel(1,"Line1");
    SetIndexLabel(2,"Line2");
    SetIndexLabel(3,"Line3");
    SetIndexLabel(4,"Line4");
    SetIndexLabel(5,"Line5");
    SetIndexLabel(6,"Line6");
    SetIndexLabel(7,"Line7");

    IndicatorShortName("Palka");
   return(0);
  }
int deinit()
  {
   return(0);
  }

int start()
  {
   for(int i=Bars;i>=0;i--) LineBuffer0[i]=0;
   for(i=Bars;i>=0;i--) LineBuffer1[i]=0;
   for(i=Bars;i>=0;i--) LineBuffer2[i]=0;
   for(i=Bars;i>=0;i--) LineBuffer3[i]=0;
   for(i=Bars;i>=0;i--) LineBuffer4[i]=0;
   for(i=Bars;i>=0;i--) LineBuffer5[i]=0;
   for(i=Bars;i>=0;i--) LineBuffer6[i]=0;
   for(i=Bars;i>=0;i--) LineBuffer7[i]=0;
   LineBuffer0[0]=Close[0];
   LineBuffer0[PPeriod]=Close[PPeriod];
   LineBuffer1[1]=Close[1];
   LineBuffer1[PPeriod+1]=Close[PPeriod+1];
   LineBuffer2[2]=Close[2];
   LineBuffer2[PPeriod+2]=Close[PPeriod+2];
   LineBuffer3[3]=Close[3];
   LineBuffer3[PPeriod+3]=Close[PPeriod+3];
   LineBuffer4[4]=Close[4];
   LineBuffer4[PPeriod+4]=Close[PPeriod+4];
   LineBuffer5[5]=Close[5];
   LineBuffer5[PPeriod+5]=Close[PPeriod+5];
   LineBuffer6[6]=Close[6];
   LineBuffer6[PPeriod+6]=Close[PPeriod+6];
   LineBuffer7[0]=(LineBuffer0[0]+LineBuffer1[1]+LineBuffer2[2]+LineBuffer3[3]+LineBuffer4[4]+LineBuffer5[5]+LineBuffer6[6])/7;
   LineBuffer7[PPeriod]=(LineBuffer0[PPeriod]+LineBuffer1[PPeriod+1]+LineBuffer2[PPeriod+2]+LineBuffer3[PPeriod+3]+LineBuffer4[PPeriod+4]+LineBuffer5[PPeriod+5]+LineBuffer6[PPeriod+6])/7;
   return(0);
  }
//+------------------------------------------------------------------+
Comments