Parabolic_best
Download script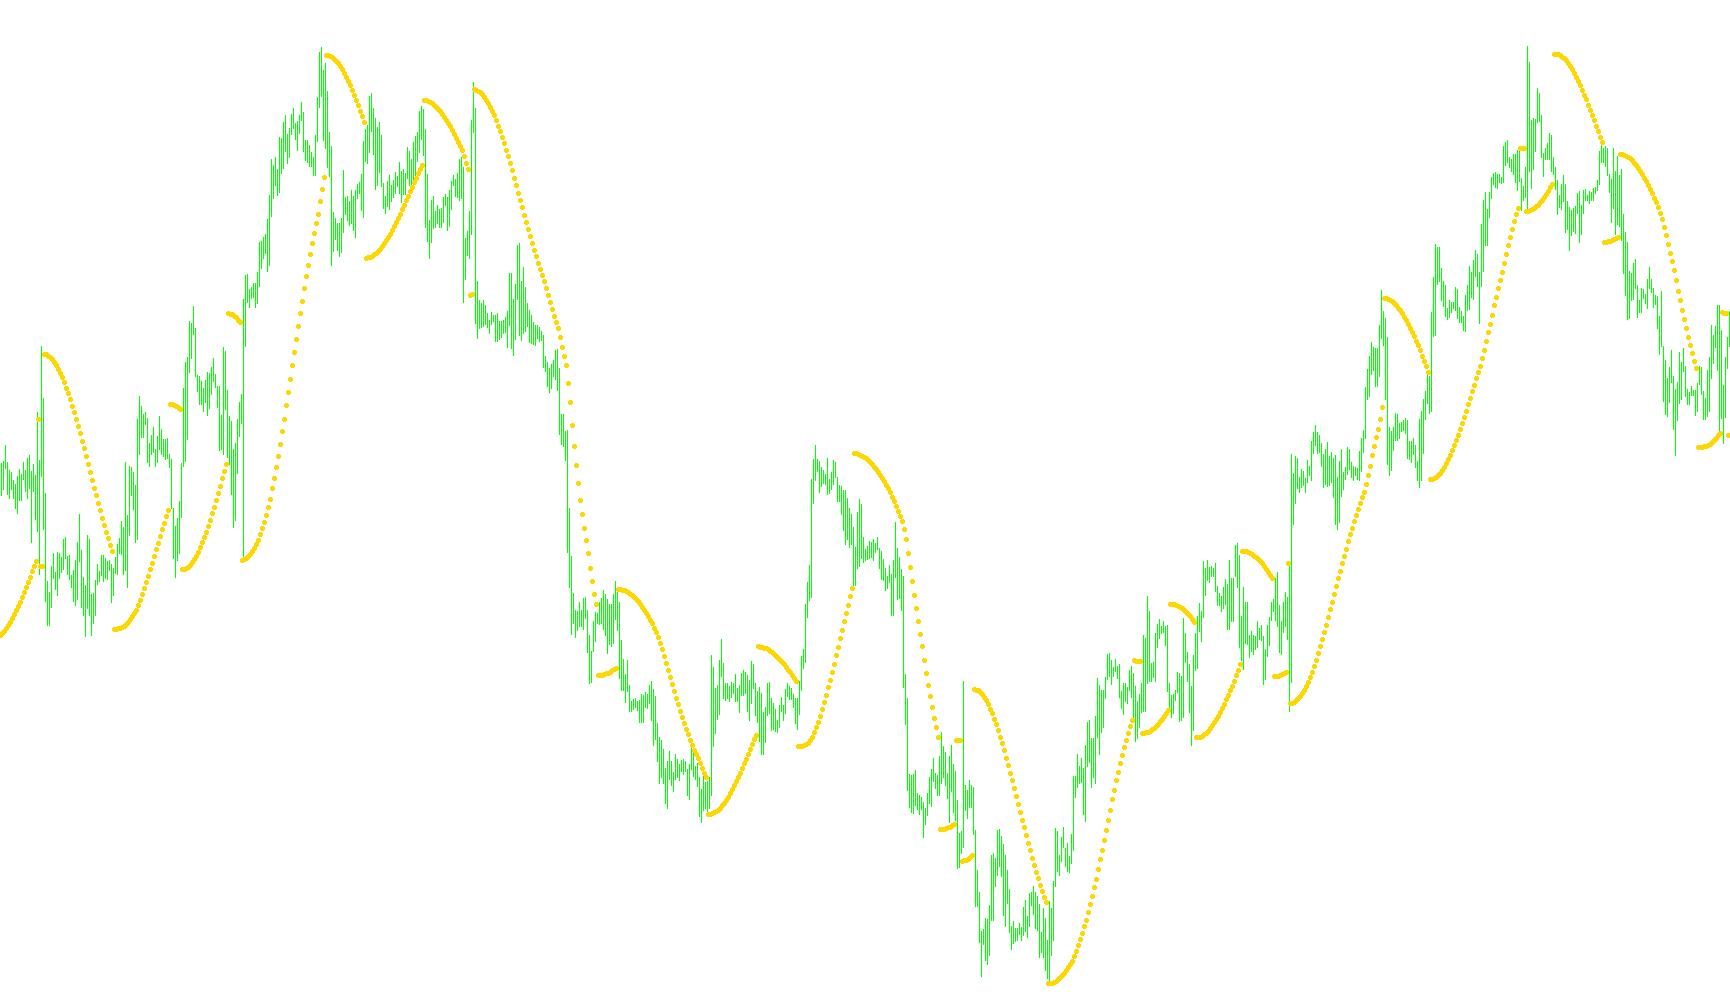
This script is a technical trading indicator designed to identify potential trend reversals and momentum shifts in price action. It operates by calculating a dynamic "Parabolic" value that reacts to market highs and lows, providing visual cues on the chart to signal when a trend might be exhausting or changing direction.
Core Operational Logic
The tool works by tracking two primary market behaviors: upward momentum (buying) and downward momentum (selling). Its logic can be broken down into three main components:
1. Dynamic Price Tracking The indicator constantly monitors the highest and lowest prices reached during a specific price movement. As the price moves, the script remembers these extreme points to establish the "boundaries" of the current trend. It focuses on identifying the peak of a rise or the valley of a fall.
2. The Parabolic Calculation Instead of using a simple moving average, this script uses a formula that projects a value forward based on two factors:
- The Step: A consistent multiplier that dictates how aggressively the indicator reacts to new price information.
- The Distance: The difference between the current price and the extreme point (high or low) identified in the previous step.
By combining these, the script creates a curve that "chases" the price. If the price moves strongly in one direction, the calculated value follows it; if the momentum slows or pulls back significantly, the calculation reflects that tension.
3. Reversal Detection (The Signal) The most important feature of this script is its ability to detect "cross-overs." The logic switches between two modes:
- Long Mode: When the price is trending up, the indicator tracks the highest points. If the calculated parabolic value crosses above the current low price, the system recognizes a potential trend exhaustion and triggers a reversal signal.
- Short Mode: When the price is trending down, the indicator tracks the lowest points. If the calculated parabolic value falls below the current high price, it signals a potential shift back toward an upward move.
Visual Behavior
When the logic detects these specific crossing points, the script places a visual marker (an arrow) on the chart. These markers are designed to appear at key levels—specifically adjusted slightly away from the actual price candles to ensure they remain clearly visible to the user without overlapping the trading data.
In essence, this tool acts as a momentum sensor that identifies when the "push" of a current trend is no longer sufficient to sustain the price, suggesting that a reversal may be imminent.
//+------------------------------------------------------------------+
//|                                               Parabolic best.mq4 |
//|                      Copyright © 2008, MetaQuotes Software Corp. |
//|                      Copyright © 2008, Ëóêàøóê Â.Ã. aka lukas1.  |
//|îðèãèíàë ëåæèò ...? Íè÷åãî íå ìåíÿë,òîëüêî "îáðåçàíèå" íî ìàëåíüêîå
//+------------------------------------------------------------------+
// âñ¸ ëèøíåå âûêèíóë. aka lukas1.
// âñ¸ ïðàâèëüíî ðàáîòàåò.  aka lukas1.
#property copyright "Copyright © 2008, MetaQuotes + lukas1"
#property link      ""

#property indicator_chart_window
#property indicator_buffers 1
#property indicator_color1 Orange
//#property indicator_width3 1
//---- input parameters
extern double    Step=0.002;
extern int Diff=20; //ñäâèã íà÷àëà öåïî÷êè ïî âåðòèêàëè â ïîèíòàõ
extern int ilimit =144;

//---- buffers
double SarBuffer[];
//----
int    save_lastreverse;
bool   save_dirlong;
double save_start;
double save_last_high;
double save_last_low;
double save_ep;
double save_sar;
double save_delta;
//+------------------------------------------------------------------+
//| Custom indicator initialization function                         |
//+------------------------------------------------------------------+
int init()
  {
//---- indicators
   IndicatorDigits(Digits+1);
//----
   SetIndexStyle(0,DRAW_ARROW);
   SetIndexArrow(0,159);
   SetIndexBuffer(0,SarBuffer);
//----
   return(0);
  }
//+------------------------------------------------------------------+
//| Ïåðåêëþ÷àòåëü - çàïîìèíàòåëü
//+------------------------------------------------------------------+
void SaveLastReverse(int last,int dir,double start,double low,double high,double ep,double sar)
  {
   save_lastreverse=last;
   save_dirlong=dir;
   save_start=start;
   save_last_low=low;
   save_last_high=high;
   save_ep=ep;
   save_sar=sar;
  }
//+------------------------------------------------------------------+
//| Parabolic Sell And Reverse system                                |
//+------------------------------------------------------------------+
int start()
  {
   static bool first=false;
   bool   dirlong;
   double start,last_high,last_low;
   double ep,sar,price_low,price_high,price;
   int    i,counted_bars=IndicatorCounted();
      int limit=ilimit;
//      SetIndexDrawBegin(0,Bars-limit);
//      SetIndexDrawBegin(1,Bars-limit);
//----
   if(Bars<3) return(0);
   dirlong=true;
   start=Step;
//--------------------------------------------+
   i=Bars-2;
   while(i>=0)
     {
      price_low=Low[i];
      price_high=High[i];
      price=SarBuffer[i+1];//òåêóùàÿ öåíà ðàâíà SarBuffer ïðåäûäóùåãî áàðà
      //sar ðàâåí öåíà ïðåäûäóùåãî áàðà ïëþñ øàã óìíîæèòü íà
      //(ñòàðàÿ öåíà ìèíóñ çíà÷åíèå SarBuffer ïðåäûäóùåãî áàðà)
      sar=price+start*(ep-price);
//----
      if(dirlong)
        {
         start+=Step;
         if(sar>price_low)
           {
            SaveLastReverse(i,true,start,price_low,last_high,ep,sar);
            start=Step;
            dirlong=false;
            ep=price_low;
            last_low=price_low;
            SarBuffer[i]=last_high-Diff*Point;
            if (SarBuffer[i]<High[i]&&SarBuffer[i]>=Low[i])
                SarBuffer[i]=High[i]+Point;
            if (SarBuffer[i]<Low[i]) SarBuffer[i]=Low[i]-Point;
            i--;
            continue;
           }
         if(ep<price_high) { last_high=price_high; ep=price_high; }
        }
//----
      else
        {
         start+=Step;
         if(sar<price_high)
           {
            SaveLastReverse(i,false,start,last_low,price_high,ep,sar);
            start=Step;
            dirlong=true;
            ep=price_high;
            last_high=price_high;
            SarBuffer[i]=last_low+Diff*Point;
            if (SarBuffer[i]>Low[i]&&SarBuffer[i]<=High[i])
                SarBuffer[i]=Low[i]-Point;
            if (SarBuffer[i]>High[i]) SarBuffer[i]=High[i]+Point;
            i--;
            continue;
           }
         if(ep>price_low) { last_low=price_low; ep=price_low; }
        }
      SarBuffer[i]=sar;
      i--;
     }
//----
   return(0);
  }
//+------------------------------------------------------------------+
Comments