Parabolic_trendchaser_alert
Download script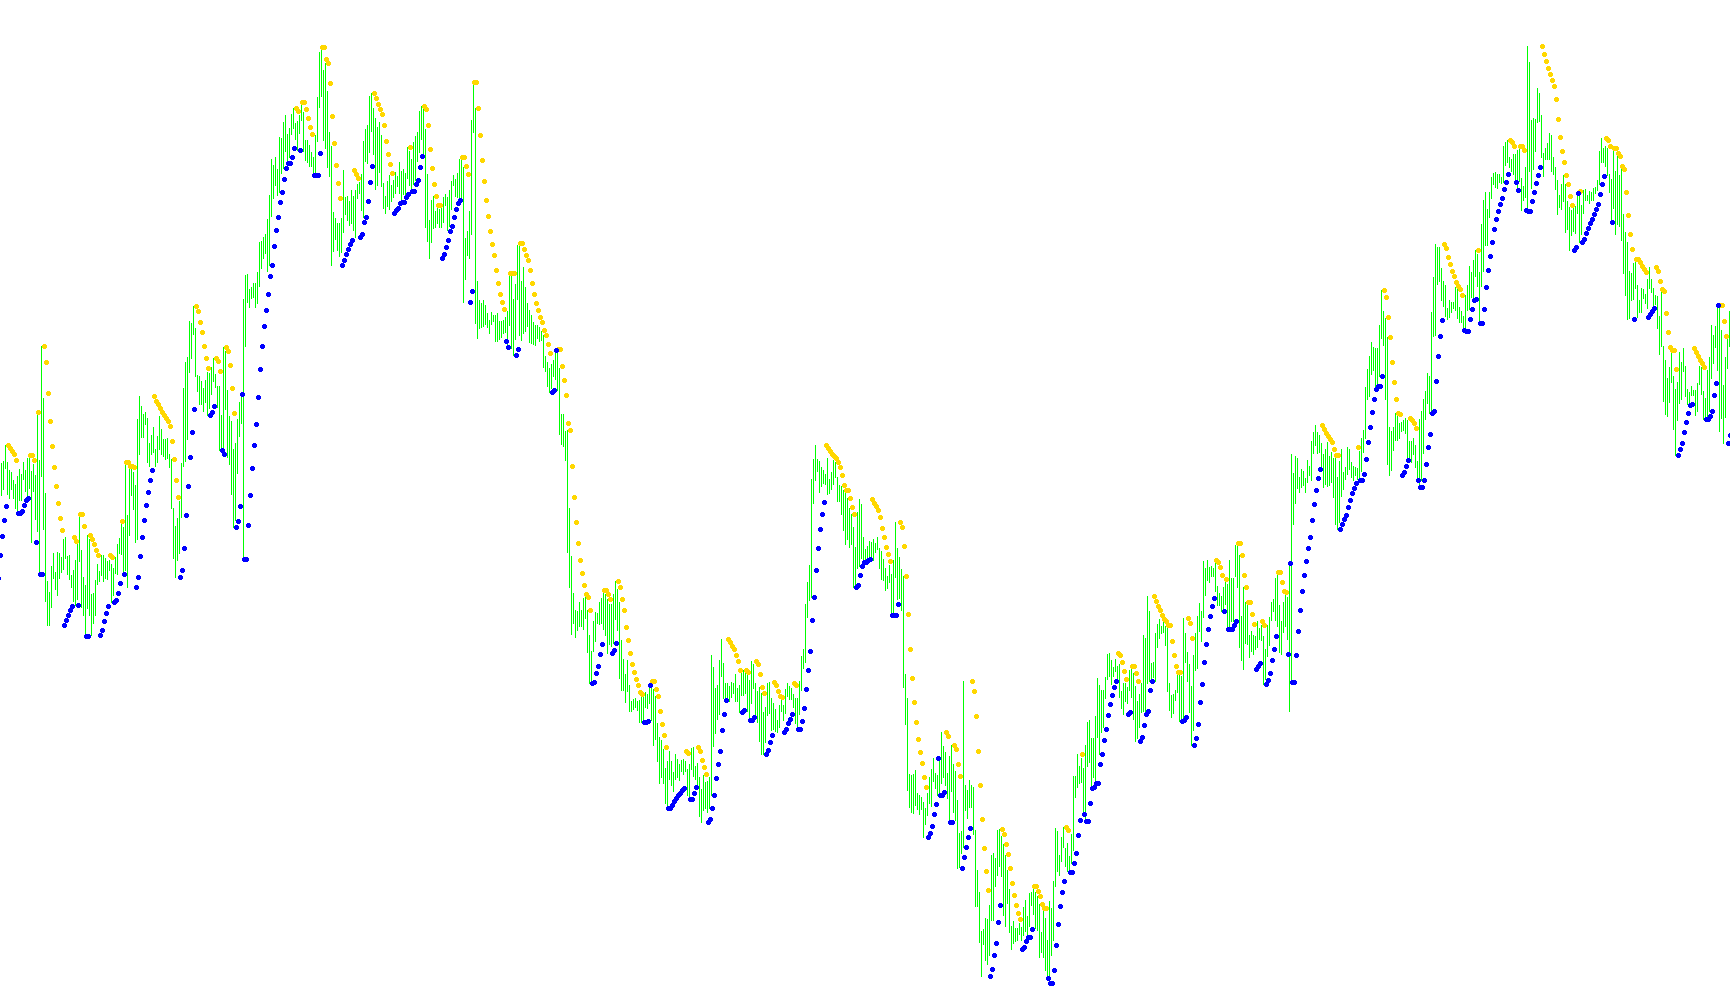
This tool is designed for traders who use the Parabolic SAR indicator to identify trend reversals and momentum shifts in the financial markets. By transforming the standard SAR dots into a more visually distinct, color-coded system, it provides a clearer perspective on whether the market is currently experiencing an upward or downward trajectory.
Core Functionality
The script automates the logic of tracking the Parabolic SAR across specific timeframes. Its primary purpose is to distinguish between two different market states:
- Down Channel Identification: When the indicator values move above the current high prices, it signals a potential bearish trend. The tool highlights these instances, allowing you to see where the "ceiling" of the movement is being established.
- Up Channel Identification: Conversely, when the indicator values fall below the price action, it identifies an upward trend. The tool marks these points to signify a bullish environment.
Key Features and Logic
To ensure the tool is practical for real-time trading, it incorporates several intelligent features:
Multi-Timeframe Analysis Unlike standard indicators that only show data for the chart you are currently viewing, this script can pull and calculate SAR data from different timeframes (ranging from 1-minute charts up to monthly charts). This allows traders to keep an eye on the "big picture" while looking at shorter, more immediate price movements.
Smart Alerts The tool includes a notification system that can be toggled on or off. It is designed to be efficient: it will send a notification only when the Parabolic SAR actually switches directions. This prevents "alert fatigue" by ensuring you are only notified of significant trend changes rather than every minor price fluctuation.
Visual Clarity By separating the data into two distinct buffers (Up and Down), the script ensures that the visual output on your trading platform is clean. It removes ambiguity, making it easier to see at a glance whether the current trend is favoring buyers or sellers based on the calculated SAR channel.
//+------------------------------------------------------------------+
//|                                                    SAR_COLOR.mq4 |
//|                                                          Kalenzo |
//|                                       http://www.foreksik.prv.pl |
//+------------------------------------------------------------------+
#property copyright "Kalenzo"
#property link      "http://www.foreksik.prv.pl"

#property indicator_color1 Red
#property indicator_color2 Blue
#property indicator_chart_window
#property indicator_buffers 2
#property indicator_width1 0
#property indicator_width2 0

double sarUp[],sarDn[];//buffers
extern bool AlertsEnabled=false;
extern double Step = 0.06;//was .01
extern double Maximum = 0.2;
extern int Precision = 7;
double alertBar;
extern int TimeFrame=0;

//+------------------------------------------------------------------+
//| Custom indicator initialization function                         |
//+------------------------------------------------------------------+
int init()
  {
//---- indicators
   SetIndexStyle(0,DRAW_ARROW,STYLE_DOT);
   SetIndexStyle(1,DRAW_ARROW,STYLE_DOT);
   SetIndexBuffer(0,sarUp);
   SetIndexBuffer(1,sarDn);
   SetIndexArrow(0,159);
   SetIndexArrow(1,159);

   IndicatorShortName("SAR COLORED");
   SetIndexLabel(0,"SAR Up Channel");
   SetIndexLabel(1,"SAR Down Channel");

   SetIndexDrawBegin(0,2);
   SetIndexDrawBegin(1,2);
//----
switch(TimeFrame)
   {
      case 1 : string TimeFrameStr="Period_M1"; break;
      case 5 : TimeFrameStr="Period_M5"; break;
      case 15 : TimeFrameStr="Period_M15"; break;
      case 30 : TimeFrameStr="Period_M30"; break;
      case 60 : TimeFrameStr="Period_H1"; break;
      case 240 : TimeFrameStr="Period_H4"; break;
      case 1440 : TimeFrameStr="Period_D1"; break;
      case 10080 : TimeFrameStr="Period_W1"; break;
      case 43200 : TimeFrameStr="Period_MN1"; break;
      default : TimeFrameStr="Current Timeframe";
   }
   return(0);
  }
//+------------------------------------------------------------------+
//| Custor indicator deinitialization function                       |
//+------------------------------------------------------------------+
int deinit()
  {
//----

//----
   return(0);
  }
//+------------------------------------------------------------------+
//| Custom indicator iteration function                              |
//+------------------------------------------------------------------+
int start()
  {
   datetime TimeArray[];
   int    i,limit,y=0,counted_bars=IndicatorCounted();

// Plot defined time frame on to current time frame
   ArrayCopySeries(TimeArray,MODE_TIME,Symbol(),TimeFrame);

   limit=Bars-counted_bars;
   for(i=0,y=0;i<limit;i++)
   {
   if (Time[i]<TimeArray[y]) y++;

      double sar = NormalizeDouble(iSAR(Symbol(),TimeFrame,Step,Maximum,y),Precision);
          if(sar >= iHigh(Symbol(),0,i))
      {
       if(AlertsEnabled==true && sarUp[i] == 0 && Bars>alertBar)
        {
        Alert("Parabolic SAR Going Down on ",Symbol(),"-",Period());
        alertBar = Bars;
       }
         sarUp[i] = sar;
         sarDn[i] = 0;
      }
    else
      {
       if(AlertsEnabled==true && sarDn[i] == 0 && Bars>alertBar)
        {
        Alert("Parabolic SAR Channel Going Up on ",Symbol(),"-",Period());
        alertBar = Bars;
        }
         sarUp[i] = 0;
         sarDn[i] = sar;
         WindowRedraw();

       }
   }
 //----
   return(0);
  }
//+------------------------------------------------------------------+
Comments