paromon
Download script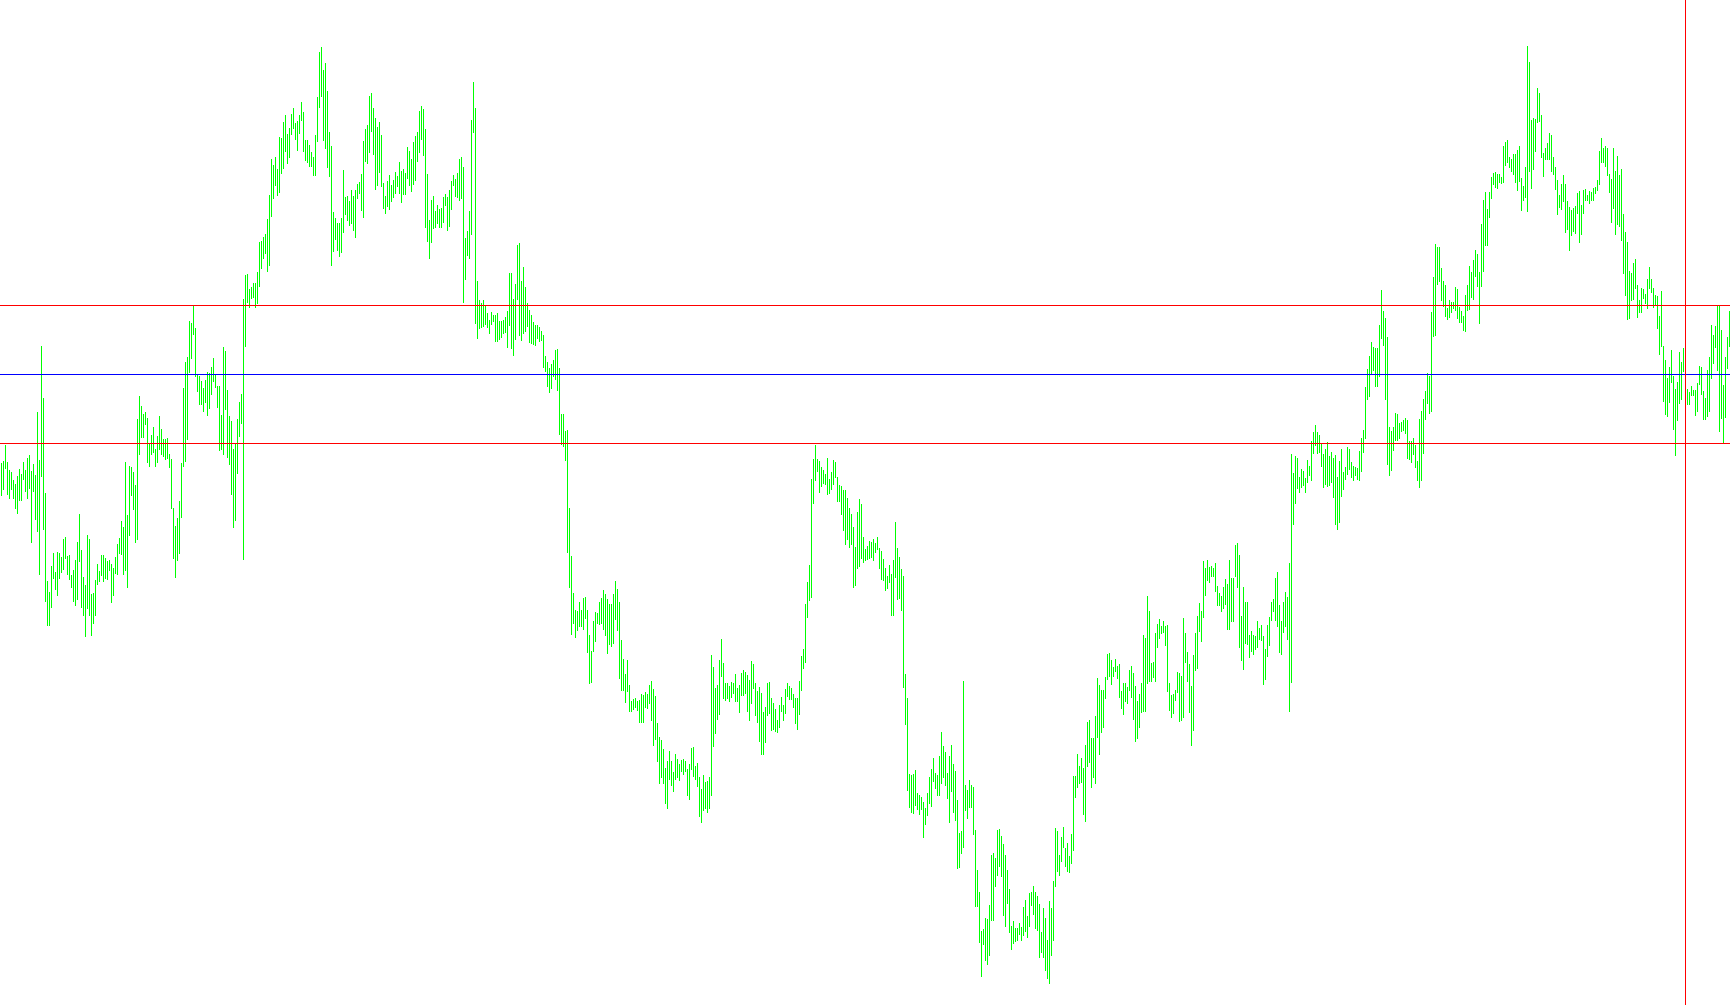
This script is designed to provide traders with a visual "corridor" analysis of daily price movements directly on their trading charts. It automatically identifies the significant price boundaries for each day—specifically the highest and lowest points reached within a specific timeframe—to help users gauge market volatility and range.
Core Functionality
The tool simplifies market data into three key visual components:
- Daily High and Low Boundaries: The script scans the price history to identify the absolute maximum and minimum prices reached during the trading day. It then projects these levels onto the current chart as horizontal lines. This allows you to see at a glance how far the price has stretched from its daily lows and highs.
- The Midpoint (Average) Line: By calculating the exact center point between the day's high and low, the script draws a third horizontal line. This serves as a visual "equilibrium" or average price for the day's range.
- Dynamic Time Filtering: The logic includes specific time-based rules to ensure accuracy. It focuses on data starting from 10:00 AM, effectively filtering out early morning noise or pre-market fluctuations that might skew the daily range calculation.
Visual Indicators & Data Display
To ensure the information is easy to interpret while trading, the script provides the following visual aids:
- Color-Coded Lines: The high and low boundaries are clearly marked (using Red for the primary tracking), while the average price line is highlighted in Blue.
- Vertical Day Marker: A vertical line is automatically positioned to indicate the start of the trading day, helping you orient yourself within the weekly chart.
- Real-Time Commentary: On the chart screen, the script provides a live text update showing the total "Corridor" size. This tells you exactly how many points wide the current day's price range is in real-time.
How it helps the trader
Instead of manually calculating the highs and lows of the day or trying to remember where the price peaked during the morning session, this script automates that data collection. It provides a constant visual "container" of the day's movement, helping you identify if the market is currently overextended (near the highs/lows) or trading near its average value.
//+------------------------------------------------------------------+
//| Par_Test.mq4                                                     |
//| Danilla                                                          |
//|                                                                  |
//+------------------------------------------------------------------+
#property copyright "Danilla"
#property link ""
//----
#property indicator_chart_window
//----
int DayOffset=7200; // 2 hours
int DayExtremumsOffset=3600;
int DayExtremumsOffsetStartTime=36000; //10:00 AM
//+------------------------------------------------------------------+
//| Custom indicator initialization function                         |
//+------------------------------------------------------------------+
int init()
  {
//---- indicators
//----
   IndicatorDigits(MarketInfo(Symbol(),MODE_DIGITS));
   SetIndexStyle(0, DRAW_LINE, STYLE_SOLID, 0, Red);
   ObjectCreate("lowline", OBJ_HLINE, 0, 0, 0);
   ObjectCreate("highline", OBJ_HLINE, 0, 0, 0);
   ObjectCreate("avline", OBJ_HLINE, 0, 0, 0);
   ObjectSet("avline", OBJPROP_COLOR, Blue);
   ObjectCreate("Day_start", OBJ_VLINE, 0, 0, 0);
   return(0);
  }
//+------------------------------------------------------------------+
//| Custor indicator deinitialization function                       |
//+------------------------------------------------------------------+
int deinit()
  {
//---- TODO: add your code here
   ObjectDelete("lowline");
   ObjectDelete("highline");
   ObjectDelete("avline");
   ObjectDelete("Day_start");
//----
   return(0);
  }
//+------------------------------------------------------------------+
//| Custom indicator iteration function                              |
//+------------------------------------------------------------------+
int start()
  {
   int counted_bars=IndicatorCounted();
//---- TODO: add your code here
   int limit;
//---- check for possible errors
   if(counted_bars<0) return(-1);
//---- last counted bar will be recounted
   if(counted_bars>0) counted_bars--;
   limit=Bars-counted_bars;
//---- macd counted in the 1-st buffer
   double lowprice=0, highprice=0, avprice=0;
   int shift=0, barsinday=0;
   int DayExtremumsBarOffset=0;
     while(DayOfWeek()==TimeDayOfWeek(Time[barsinday]+DayOffset))
     {
      barsinday++;
     }
   barsinday--;
   if (CurTime ()%(60*60*24) > (10*60*60) )
     {
        while((Time[0]-Time[DayExtremumsBarOffset]<DayExtremumsOffset) && (Time[DayExtremumsBarOffset]% (60*60*24)>(10*60*60))) {
         DayExtremumsBarOffset++;
        }
      DayExtremumsBarOffset--;
     }
   ObjectMove("Day_start", 0, Time[barsinday], 0);
   shift=Lowest(NULL, 0, MODE_LOW, barsinday-DayExtremumsBarOffset, DayExtremumsBarOffset);
   lowprice=Low[shift];
   ObjectMove("lowline", 0, Time[0], lowprice);
   shift=Highest(NULL, 0, MODE_HIGH, barsinday-DayExtremumsBarOffset, DayExtremumsBarOffset);
   highprice=High[shift];
   ObjectMove("highline",0, Time[0], highprice);
   avprice=(highprice+lowprice)/2;
   ObjectMove("avline", 0, Time[0], avprice);
   Comment("\n","Paramon\'s day: Corridor ", (highprice-lowprice)*MathPow(10, MarketInfo(Symbol(), MODE_DIGITS)), " points \n");
//----
   return(0);
  }
//+------------------------------------------------------------------+
Comments