paromon2
Download script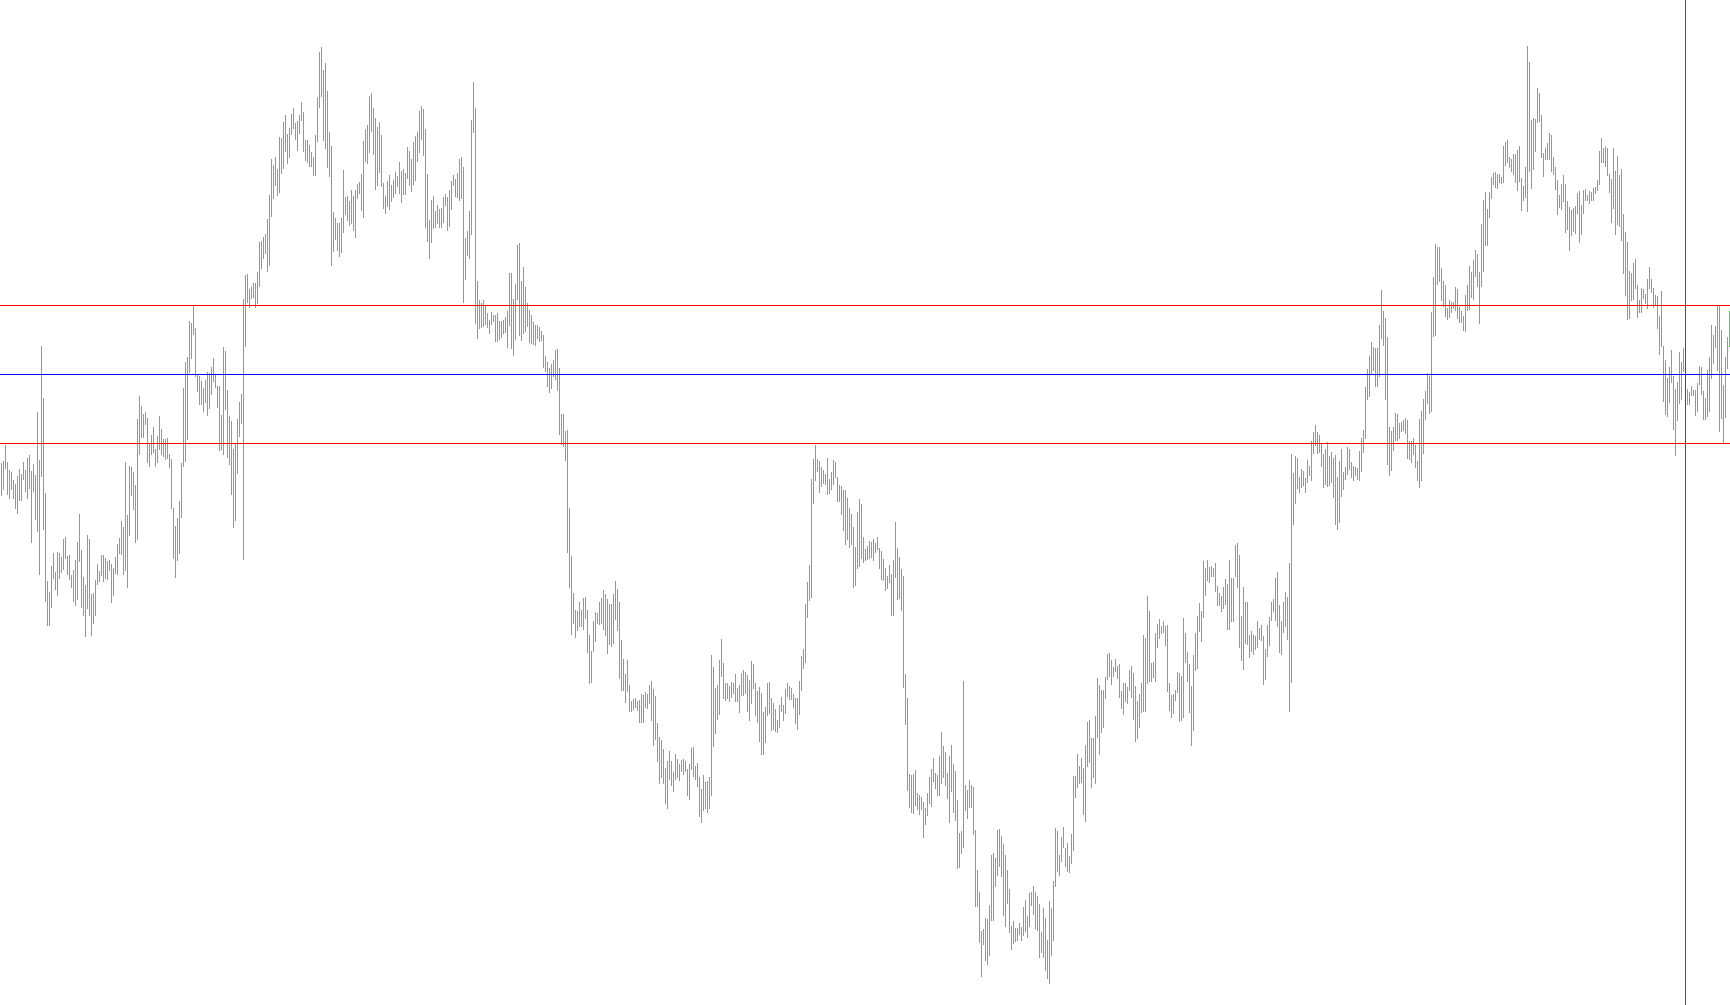
This script is designed to work as a visual tool on your trading charts, helping you identify and monitor specific price boundaries during the trading day. Its primary purpose is to calculate and display a "trading corridor" based on significant historical price points.
Core Functionality
The logic focuses on identifying the highest and lowest prices reached during a specific portion of the current trading day. Instead of showing every single movement, it filters the data to focus on a specific window of time, allowing traders to see the established boundaries for that session.
How It Works
- Time Filtering: The script automatically calculates where the current trading day begins and identifies a specific timeframe for analysis. It specifically looks at price action occurring after 10:00 AM to filter out early morning fluctuations or "noise."
- Identifying Extremes: Once the correct time window is established, the tool scans back through the historical bars to find two key pieces of information:
- The absolute Lowest Price reached.
- The absolute Highest Price reached.
- Visual Indicators: It then draws three distinct horizontal lines on your chart to represent these levels:
- Low Line: A red line marking the floor of the day's price action.
- High Line: A red line marking the ceiling of the day's price action.
- Average Line: A blue line positioned exactly in the middle of the high and low points, representing the equilibrium price for that session.
Practical Usage
To help you keep track of market volatility at a glance, the script also provides an automated text comment on your screen. This display shows you the total "Corridor" size in points—the exact distance between the day's high and low.
By providing these visual boundaries and the calculated range, the tool helps traders understand the current day's volatility and identify potential support and resistance levels established by the market's opening movements.
//+------------------------------------------------------------------+
//| Par_Test.mq4 |
//| Danilla |
//| |
//+------------------------------------------------------------------+
#property copyright "Danilla"
#property link ""

#property indicator_chart_window


int DayOffset = 7200; // 2 hours
int DayExtremumsOffset = 3600;
int DayExtremumsOffsetStartTime = 36000; //10:00 AM
//+------------------------------------------------------------------+
//| Custom indicator initialization function |
//+------------------------------------------------------------------+
int init()
{
//---- indicators
//----

IndicatorDigits(MarketInfo(Symbol(),MODE_DIGITS));

SetIndexStyle(0, DRAW_LINE, STYLE_SOLID, 0, Red);
ObjectCreate("lowline", OBJ_HLINE, 0, 0, 0);
ObjectCreate("highline", OBJ_HLINE, 0, 0, 0);

ObjectCreate("avline", OBJ_HLINE, 0, 0, 0);

ObjectSet("avline", OBJPROP_COLOR, Blue);
ObjectCreate("Day_start", OBJ_VLINE, 0, 0, 0);

return(0);
}
//+------------------------------------------------------------------+
//| Custor indicator deinitialization function |
//+------------------------------------------------------------------+
int deinit()
{
//---- TODO: add your code here
ObjectDelete("lowline");
ObjectDelete("highline");
ObjectDelete("avline");
ObjectDelete("Day_start");

//----
return(0);
}
//+------------------------------------------------------------------+
//| Custom indicator iteration function |
//+------------------------------------------------------------------+
int start()
{
int counted_bars=IndicatorCounted();
//---- TODO: add your code here
int limit;
//---- check for possible errors
if(counted_bars<0) return(-1);
//---- last counted bar will be recounted
if(counted_bars>0) counted_bars--;
limit=Bars-counted_bars;
//---- macd counted in the 1-st buffer


double lowprice=0, highprice=0, avprice=0;
int shift=0, barsinday=0;
int DayExtremumsBarOffset = 0;

while (DayOfWeek()==TimeDayOfWeek(Time[barsinday]+DayOffset)) {
barsinday++;
}
barsinday--;


if (CurTime () % (60*60*24) > (10*60*60) )
{
while ((Time[0]-Time[DayExtremumsBarOffset]<DayExtremumsOffset) && (Time[DayExtremumsBarOffset]% (60*60*24)>(10*60*60))) {
DayExtremumsBarOffset++;
}
DayExtremumsBarOffset--;
}

ObjectMove("Day_start", 0, Time[barsinday], 0);

shift=Lowest(NULL, 0, MODE_LOW, barsinday-DayExtremumsBarOffset, DayExtremumsBarOffset);
lowprice=Low[shift];
ObjectMove("lowline", 0, Time[0], lowprice);

shift=Highest(NULL, 0, MODE_HIGH, barsinday-DayExtremumsBarOffset, DayExtremumsBarOffset);
highprice=High[shift];
ObjectMove("highline",0, Time[0], highprice);

avprice=(highprice+lowprice)/2;
ObjectMove("avline", 0, Time[0], avprice);

Comment("\n","Paramon\'s day: Corridor ", (highprice-lowprice)*MathPow(10, MarketInfo(Symbol(), MODE_DIGITS)), " points \n");

//----
return(0);
}
//+------------------------------------------------------------------+
Comments