PB_autopivots
Download script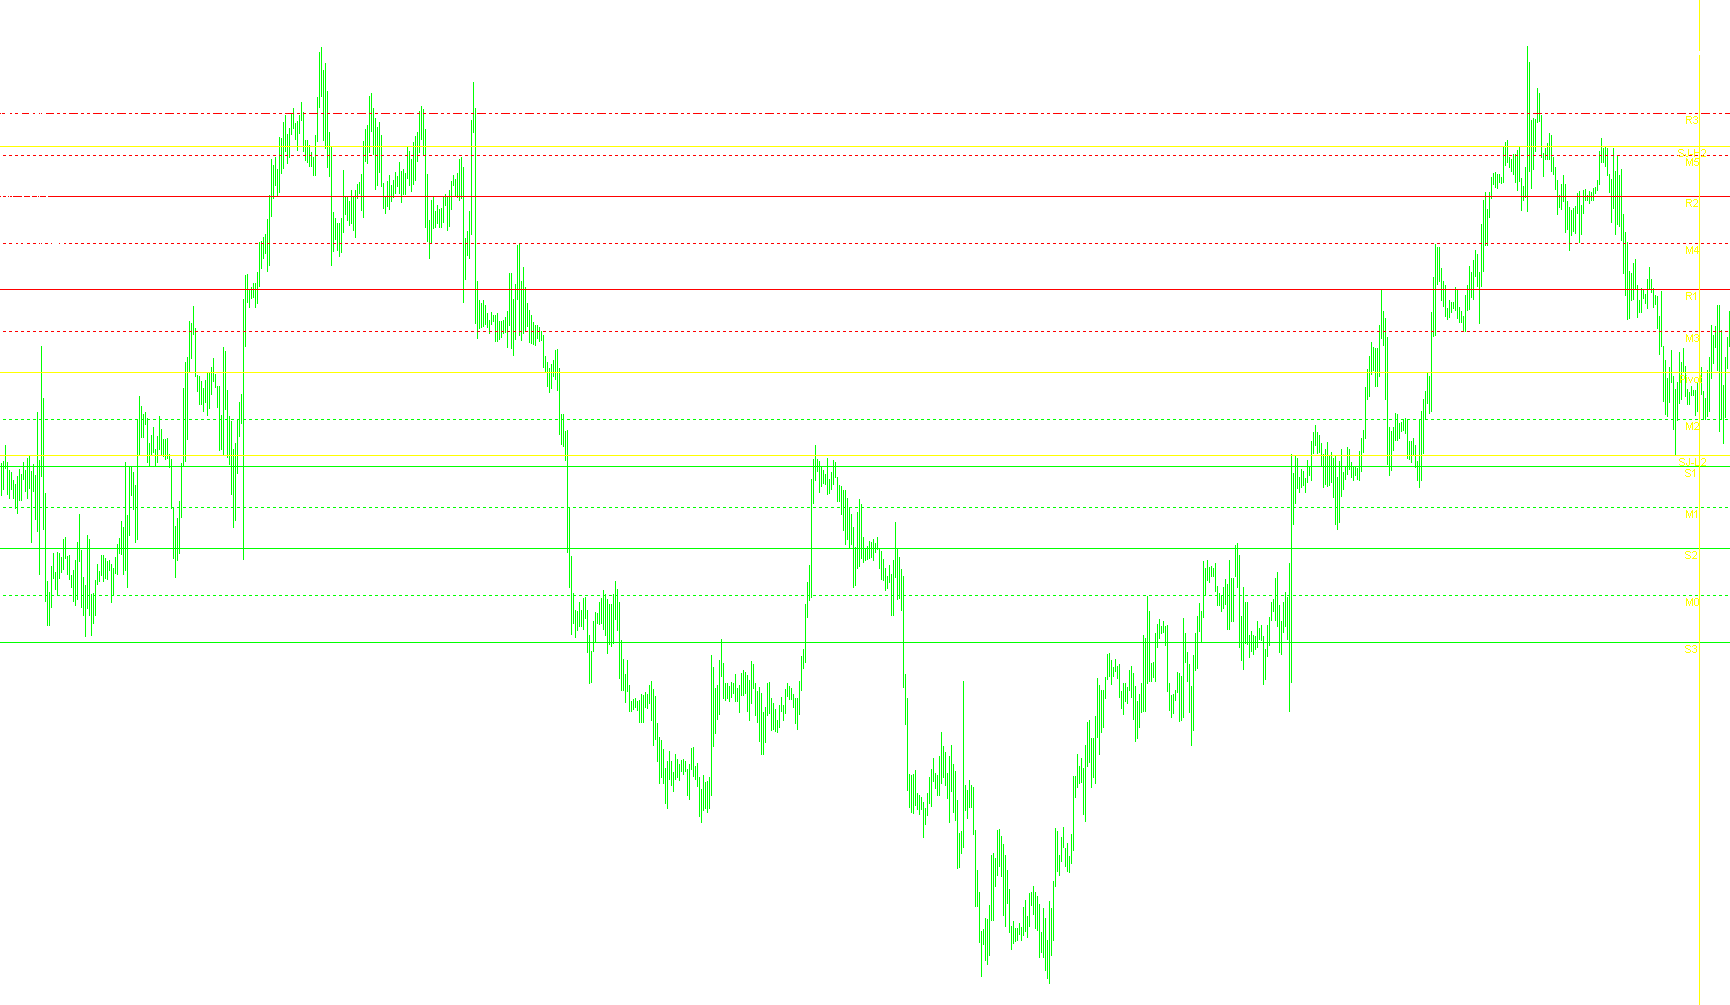
This script is a professional-grade trading tool designed for the MetaTrader 4 platform. It automates the calculation and visual representation of several advanced technical analysis levels, specifically "Pivot Points," which are used by traders to identify potential support and resistance zones in the market.
Core Functionality
The primary purpose of this tool is to take historical price data—specifically from the previous trading day—and use it to project key price levels for the current trading day. By doing this automatically, it removes the need for manual calculations and ensures that the technical levels are consistent and accurate across different timeframes.
Key Technical Components
The logic operates through three main layers of calculation:
1. Data Collection and Time Synchronization The script begins by gathering price data (Highs, Lows, Opens, and Closes) from both daily and hourly charts. It includes a specific "Time Zone" adjustment feature, allowing it to align with different global markets (such as EST). It scans through past hourly bars to precisely identify when the previous day ended to ensure that calculations are based on the correct trading session.
2. Pivot Point Systems The script calculates and displays three distinct types of support and resistance levels:
- Standard Pivot Points: These calculate a central "Pivot" price and extend into Resistance (R1, R2, R3) and Support (S1, S2, S3) levels.
- Camarilla Levels: A specific variation of pivots often used by day traders to identify reversal points. These are displayed as H3, H4, L3, and L4 levels.
- Midpoint Pivots: These provide more granular detail by breaking down the main pivot zones into smaller segments (M0 through M5), helping traders find "sub-zones" within larger price movements.
3. Intraday Trend Analysis Beyond simple static lines, the script incorporates logic to identify broader intraday trends. It looks back at a 48-hour window to determine high and low boundaries. This helps traders understand if the current price action is trending significantly higher or lower than the recent multi-day range.
Visual Representation and User Interface
The tool provides a comprehensive visual experience on the trading chart:
- Dynamic Labeling: It creates text labels for every calculated level so the user can immediately identify what each line represents.
- Color Coding: Different levels are assigned specific colors (such as Yellow, Red, and Lime) to distinguish between Support, Resistance, and Pivot points at a glance.
- Automated Information Dashboard: In the corner of the screen, the script generates a detailed text summary. This includes the current "Projected Range," "Previous Day's Range," and the specific Open/High/Low/Close figures used for the current session's calculations.
- Visual Markers: The tool automatically draws a vertical line to mark the exact start of the trading session, providing a clear visual anchor for the beginning of the day.
Summary for the User
In simple terms, this script acts as an automated "map maker" for your charts. It looks at what happened yesterday, does the math to figure out where the "walls" (resistance) and "floors" (support) might be today, and then draws those maps on your screen automatically, complete with a data dashboard to keep you informed of the session's progress.
//+-------------------------------------------------------------------+
//|                                                 PB_Autopivots.mq4 |
//|                             Adapted from Pivot Lines TimeZone.mq4 |
//|                       Copyright © 2004, MetaQuotes Software Corp. |
//|                                         http://www.metaquotes.net |
//|                                Made/Modified by Alejandro Galindo |
//|                                                                   |
//|                                                                   |
//|                                       help me to continue coding  |
//|                                PayPal donation to ag@elcactus.com |
//+-------------------------------------------------------------------+
#property copyright "Copyright © 2004, MetaQuotes Software Corp."
#property link      "http://www.metaquotes.net"

#property indicator_chart_window

extern int TimeZone=5; // midnight EST
extern bool pivots = true;
extern bool camarilla = false;
extern bool midpivots = true;

double day_high=0;
double day_low=0;
double yesterday_high=0;
double yesterday_open=0;
double yesterday_low=0;
double yesterday_close=0;
double today_open=0;
double today_high=0;
double today_low=0;
double P=0;
double Q=0;
double R1,R2,R3;
double M0,M1,M2,M3,M4,M5;
double S1,S2,S3;
double H4,H3,L4,L3;
double nQ=0;
double nD=0;
double D=0;
double rates_h1[2][6];
double rates_d1[2][6];
datetime timeEST;
// Scott Jones - intraday trend,variable for High/Low of last 2 days
double H2,L2;
string s;
bool found;
int firstbar,vbar;

//+------------------------------------------------------------------+
//| Custom indicator initialization function                         |
//+------------------------------------------------------------------+
int init()
  {
//---- indicators
 R1=0; R2=0; R3=0;
 M0=0; M1=0; M2=0; M3=0; M4=0; M5=0;
 S1=0; S2=0; S3=0;
 H4=0; H3=0; L4=0; L3=0;

//----
   return(0);
  }
//+------------------------------------------------------------------+
//| Custor indicator deinitialization function                       |
//+------------------------------------------------------------------+
int deinit()
  {
//---- TODO: add your code here
ObjectDelete("R1 Label");
ObjectDelete("R1 Line");
ObjectDelete("R2 Label");
ObjectDelete("R2 Line");
ObjectDelete("R3 Label");
ObjectDelete("R3 Line");
ObjectDelete("S1 Label");
ObjectDelete("S1 Line");
ObjectDelete("S2 Label");
ObjectDelete("S2 Line");
ObjectDelete("S3 Label");
ObjectDelete("S3 Line");
ObjectDelete("P Label");
ObjectDelete("P Line");
ObjectDelete("H4 Label");
ObjectDelete("H4 Line");
ObjectDelete("H3 Label");
ObjectDelete("H3 Line");
ObjectDelete("L3 Label");
ObjectDelete("L3 Line");
ObjectDelete("L4 Label");
ObjectDelete("L4 Line");
ObjectDelete("M5 Label");
ObjectDelete("M5 Line");
ObjectDelete("M4 Label");
ObjectDelete("M4 Line");
ObjectDelete("M3 Label");
ObjectDelete("M3 Line");
ObjectDelete("M2 Label");
ObjectDelete("M2 Line");
ObjectDelete("M1 Label");
ObjectDelete("M1 Line");
ObjectDelete("M0 Label");
ObjectDelete("M0 Line");
// Line for Scott Jones H2 & L2
ObjectDelete("SJ-H2");
ObjectDelete("SJ-H2 Label");
ObjectDelete("SJ-L2");
ObjectDelete("SJ-L2 Label");
ObjectDelete("Pivots");
ObjectDelete("PivotsT");
Comment("");
//----
   return(0);
  }
//+------------------------------------------------------------------+
//| Custom indicator iteration function                              |
//+------------------------------------------------------------------+
int start()
  {
  int i=0, j=0,handle,pivotstart;
//---- TODO: add your code here

//---- exit if period is greater than or a daily charts
if(Period() >= 1440)
{
Print("Error - Chart period is greater than 1 day.");
return(-1); // then exit
}

//---- Get new daily prices

ArrayCopyRates(rates_d1, Symbol(), PERIOD_D1);
yesterday_high = rates_d1[1][3];
yesterday_low = rates_d1[1][2];
day_high = rates_d1[0][3];
day_low = rates_d1[0][2];

ArrayCopyRates(rates_h1, Symbol(), PERIOD_H1);
for (i=0;i<=25;i++)
{
   if (TimeMinute(rates_h1[i][0])==0 && (TimeHour(rates_h1[i][0])-TimeZone)==0)
   {
      yesterday_close = rates_h1[i+1][4];
      // Peter Bain's close is open of next bar
      yesterday_close = rates_h1[i][1];
      yesterday_open = rates_h1[i+24][1];pivotstart=i;
      today_open = rates_h1[i][1];
      // brought in for accuracy
      yesterday_high = 0;
      yesterday_low = 9999;
      for (j=i+1;j<=i+24;j++)
      {
       if (rates_h1[j][3]>yesterday_high) {yesterday_high=rates_h1[j][3];}
       if (rates_h1[j][2]<yesterday_low)  {yesterday_low=rates_h1[j][2];}
      }
      day_high = 0;
      day_low = 9999;
      for (j=0;j<=i;j++)
      {
       if (rates_h1[j][3]>day_high) {day_high=rates_h1[j][3];}
       if (rates_h1[j][2]<day_low)  {day_low=rates_h1[j][2];}
      }
      // Scott Jones intraday trend,ind out High/Low of last two days
      H2=0;L2=9999;
      for (j=i+1;j<=i+48;j++)
      {
       if (rates_h1[j][3]>H2) {H2=rates_h1[j][3];}
       if (rates_h1[j][2]<L2) {L2=rates_h1[j][2];}
      }
     handle=FileOpen("rates.csv",FILE_CSV|FILE_WRITE,';');
     if(handle>0)
     {
      // write table columns headers
      FileWrite(handle, "Time;Open;High;Low;Close;Volume");
      // write yesterday's data
      for(int k=i+1; k<=i+24; k++)
      FileWrite(handle,TimeToStr(rates_h1[k][0],TIME_DATE|TIME_MINUTES),DoubleToStr(rates_h1[k][1],4),DoubleToStr(rates_h1[k][3],4),DoubleToStr(rates_h1[k][2],4),DoubleToStr(rates_h1[k][4],4));
      FileWrite(handle,"O=",DoubleToStr(yesterday_open,4),"H=",DoubleToStr(yesterday_high,4),"L=",DoubleToStr(yesterday_low,4),"C=",DoubleToStr(yesterday_close,4));
      for(j=0; j<=i; j++)
      FileWrite(handle,TimeToStr(rates_h1[j][0],TIME_DATE|TIME_MINUTES),DoubleToStr(rates_h1[j][1],4),DoubleToStr(rates_h1[j][3],4),DoubleToStr(rates_h1[j][2],4),DoubleToStr(rates_h1[j][4],4));
      FileWrite(handle,"Today's H=",DoubleToStr(day_high,4),"Today's L=",DoubleToStr(day_low,4));
     FileClose(handle);
    }
      break;
   }
}


//---- Calculate Pivots

D = (day_high - day_low);
Q = (yesterday_high - yesterday_low);
P = (yesterday_high + yesterday_low + yesterday_close) / 3;
R1 = (2*P)-yesterday_low;
S1 = (2*P)-yesterday_high;
R2 = P+(yesterday_high - yesterday_low);
S2 = P-(yesterday_high - yesterday_low);

	H4 = (Q*0.55)+yesterday_close;
	H3 = (Q*0.27)+yesterday_close;
	R3 = (2*P)+(yesterday_high-(2*yesterday_low));
	M5 = (R2+R3)/2;
//	R2 = P-S1+R1;
	M4 = (R1+R2)/2;
//	R1 = (2*P)-yesterday_low;
	M3 = (P+R1)/2;
//	P = (yesterday_high + yesterday_low + yesterday_close)/3;
	M2 = (P+S1)/2;
//	S1 = (2*P)-yesterday_high;
	M1 = (S1+S2)/2;
//	S2 = P-R1+S1;
	S3 = (2*P)-((2* yesterday_high)-yesterday_low);
	L3 = yesterday_close-(Q*0.27);
	L4 = yesterday_close-(Q*0.55);
	M0 = (S2+S3)/2;

if (Q > 5)
{
	nQ = Q;
}
else
{
	nQ = Q*10000;
}

if (D > 5)
{
	nD = D;
}
else
{
	nD = D*10000;
}
s="Pivots Time-" +TimeToStr(rates_h1[pivotstart][0],TIME_DATE|TIME_MINUTES)+" GMT/";
timeEST=rates_h1[pivotstart][0]-TimeZone*60*60;
s=s+TimeToStr(timeEST,TIME_MINUTES)+" EST";
if (yesterday_close>=yesterday_open) {s=s+" M2/M4 Day\n";} else {s=s+" M1/M3 Day\n";}
s=s+"Projected Range="+DoubleToStr((R2-S2)/Point,0);
s=s+" Previous Days Range= "+DoubleToStr(nQ,0)+" Current Days Range= "+DoubleToStr(nD,0)+"\n";
s=s+"Open="+DoubleToStr(yesterday_open,4)+" High="+DoubleToStr(yesterday_high,4);
s=s+" Low="+DoubleToStr(yesterday_low,4)+" Close="+DoubleToStr(yesterday_close,4)+"\n\n";
s=s+"R3="+DoubleToStr(R3,4)+"\n";
s=s+"M5="+DoubleToStr(M5,4)+"\n";
s=s+"R2="+DoubleToStr(R2,4)+"\n";
s=s+"M4="+DoubleToStr(M4,4)+"\n";
s=s+"R1="+DoubleToStr(R1,4)+"\n";
s=s+"M3="+DoubleToStr(M3,4)+"\n";
s=s+"PP="+DoubleToStr(P,4)+"\n";
s=s+"M2="+DoubleToStr(M2,4)+"\n";
s=s+"S1="+DoubleToStr(S1,4)+"\n";
s=s+"M1="+DoubleToStr(M1,4)+"\n";
s=s+"S2="+DoubleToStr(S2,4)+"\n";
s=s+"M0="+DoubleToStr(M0,4)+"\n";
s=s+"S3="+DoubleToStr(S3,4)+"\n\n";
//Comment("High= ",yesterday_high,"    Previous Days Range= ",nQ,"\nLow= ",yesterday_low,"    Current Days Range= ",nD,"\nClose= ",yesterday_close,"\nOpen= ",yesterday_open);
s=s+"Scott Jones Intraday Trend Levels\n";
s=s+"High 2= "+DoubleToStr(H2,4)+"\n";
s=s+"Low 2= "+DoubleToStr(L2,4)+"\n";
Comment(s);

//---- Set line labels on chart window

//---- Pivot Lines
   if (pivots==true)
   {
      if(ObjectFind("R1 label") != 0)
      {
      ObjectCreate("R1 label", OBJ_TEXT, 0, Time[20], R1);
      ObjectSetText("R1 label", " R1", 8, "Arial", Yellow);
      }
      else
      {
      ObjectMove("R1 label", 0, Time[20], R1);
      }

      if(ObjectFind("R2 label") != 0)
      {
      ObjectCreate("R2 label", OBJ_TEXT, 0, Time[20], R2);
      ObjectSetText("R2 label", " R2", 8, "Arial", Yellow);
      }
      else
      {
      ObjectMove("R2 label", 0, Time[20], R2);
      }

      if(ObjectFind("R3 label") != 0)
      {
      ObjectCreate("R3 label", OBJ_TEXT, 0, Time[20], R3);
      ObjectSetText("R3 label", " R3", 8, "Arial", Yellow);
      }
      else
      {
      ObjectMove("R3 label", 0, Time[20], R3);
      }

      if(ObjectFind("P label") != 0)
      {
      ObjectCreate("P label", OBJ_TEXT, 0, Time[20], P);
      ObjectSetText("P label", "Pivot", 8, "Arial", Yellow);
      }
      else
      {
      ObjectMove("P label", 0, Time[20], P);
      }

      if(ObjectFind("S1 label") != 0)
      {
      ObjectCreate("S1 label", OBJ_TEXT, 0, Time[20], S1);
      ObjectSetText("S1 label", "S1", 8, "Arial", Yellow);
      }
      else
      {
      ObjectMove("S1 label", 0, Time[20], S1);
      }

      if(ObjectFind("S2 label") != 0)
      {
      ObjectCreate("S2 label", OBJ_TEXT, 0, Time[20], S2);
      ObjectSetText("S2 label", "S2", 8, "Arial", Yellow);
      }
      else
      {
      ObjectMove("S2 label", 0, Time[20], S2);
      }

      if(ObjectFind("S3 label") != 0)
      {
      ObjectCreate("S3 label", OBJ_TEXT, 0, Time[20], S3);
      ObjectSetText("S3 label", "S3", 8, "Arial", Yellow);
      }
      else
      {
      ObjectMove("S3 label", 0, Time[20], S3);
      }

//---  Draw  Pivot lines on chart
      if(ObjectFind("S1 line") != 0)
      {
      ObjectCreate("S1 line", OBJ_HLINE, 0, Time[40], S1);
      ObjectSet("S1 line", OBJPROP_STYLE, STYLE_SOLID);
      ObjectSet("S1 line", OBJPROP_COLOR, Lime);
      }
      else
      {
      ObjectMove("S1 line", 0, Time[40], S1);
      }

      if(ObjectFind("S2 line") != 0)
      {
      ObjectCreate("S2 line", OBJ_HLINE, 0, Time[40], S2);
      ObjectSet("S2 line", OBJPROP_STYLE, STYLE_SOLID);
      ObjectSet("S2 line", OBJPROP_COLOR, Lime);
      }
      else
      {
      ObjectMove("S2 line", 0, Time[40], S2);
      }

      if(ObjectFind("S3 line") != 0)
      {
      ObjectCreate("S3 line", OBJ_HLINE, 0, Time[40], S3);
      ObjectSet("S3 line", OBJPROP_STYLE, STYLE_SOLID);
      ObjectSet("S3 line", OBJPROP_COLOR, Lime);
      }
      else
      {
      ObjectMove("S3 line", 0, Time[40], S3);
      }

      if(ObjectFind("P line") != 0)
      {
      ObjectCreate("P line", OBJ_HLINE, 0, Time[40], P);
      ObjectSet("P line", OBJPROP_STYLE, STYLE_SOLID);
      ObjectSet("P line", OBJPROP_COLOR, Yellow);
      }
      else
      {
      ObjectMove("P line", 0, Time[40], P);
      }

      if(ObjectFind("R1 line") != 0)
      {
      ObjectCreate("R1 line", OBJ_HLINE, 0, Time[40], R1);
      ObjectSet("R1 line", OBJPROP_STYLE, STYLE_SOLID);
      ObjectSet("R1 line", OBJPROP_COLOR, Red);
      }
      else
      {
      ObjectMove("R1 line", 0, Time[40], R1);
      }

      if(ObjectFind("R2 line") != 0)
      {
      ObjectCreate("R2 line", OBJ_HLINE, 0, Time[40], R2);
      ObjectSet("R2 line", OBJPROP_STYLE, STYLE_SOLID);
      ObjectSet("R2 line", OBJPROP_COLOR, Red);
      }
      else
      {
      ObjectMove("R2 line", 0, Time[40], R2);
      }

      if(ObjectFind("R3 line") != 0)
      {
      ObjectCreate("R3 line", OBJ_HLINE, 0, Time[40], R3);
      ObjectSet("R3 line", OBJPROP_STYLE, STYLE_DASHDOTDOT);
      ObjectSet("R3 line", OBJPROP_COLOR, Red);
      }
      else
      {
      ObjectMove("R3 line", 0, Time[40], R3);
      }
   }
//---- End of Pivot Line Draw


//----- Camarilla Lines

   if (camarilla==true)
   {
      if(ObjectFind("H4 label") != 0)
      {
      ObjectCreate("H4 label", OBJ_TEXT, 0, Time[20], H4);
      ObjectSetText("H4 label", " H4", 8, "Arial", White);
      }
      else
      {
      ObjectMove("H4 label", 0, Time[20], H4);
      }

      if(ObjectFind("H3 label") != 0)
      {
      ObjectCreate("H3 label", OBJ_TEXT, 0, Time[20], H3);
      ObjectSetText("H3 label", " H3", 8, "Arial", White);
      }
      else
      {
      ObjectMove("H3 label", 0, Time[20], H3);
      }

      if(ObjectFind("L3 label") != 0)
      {
      ObjectCreate("L3 label", OBJ_TEXT, 0, Time[20], L3);
      ObjectSetText("L3 label", " L3", 8, "Arial", White);
      }
      else
      {
      ObjectMove("L3 label", 0, Time[20], L3);
      }

      if(ObjectFind("L4 label") != 0)
      {
      ObjectCreate("L4 label", OBJ_TEXT, 0, Time[20], L4);
      ObjectSetText("L4 label", " L4", 8, "Arial", White);
      }
      else
      {
      ObjectMove("L4 label", 0, Time[20], L4);
      }

//---- Draw Camarilla lines on Chart
      if(ObjectFind("H4 line") != 0)
      {
      ObjectCreate("H4 line", OBJ_HLINE, 0, Time[40], H4);
      ObjectSet("H4 line", OBJPROP_STYLE, STYLE_DASHDOTDOT);
      ObjectSet("H4 line", OBJPROP_COLOR, Yellow);
      }
      else
      {
      ObjectMove("H4 line", 0, Time[40], H4);
      }

      if(ObjectFind("H3 line") != 0)
      {
      ObjectCreate("H3 line", OBJ_HLINE, 0, Time[40], H3);
      ObjectSet("H3 line", OBJPROP_STYLE, STYLE_DASHDOTDOT);
      ObjectSet("H3 line", OBJPROP_COLOR, Yellow);
      }
      else
      {
      ObjectMove("H3 line", 0, Time[40], H3);
      }

      if(ObjectFind("L3 line") != 0)
      {
      ObjectCreate("L3 line", OBJ_HLINE, 0, Time[40], L3);
      ObjectSet("L3 line", OBJPROP_STYLE, STYLE_DASHDOTDOT);
      ObjectSet("L3 line", OBJPROP_COLOR, Yellow);
      }
      else
      {
      ObjectMove("L3 line", 0, Time[40], L3);
      }

      if(ObjectFind("L4 line") != 0)
      {
      ObjectCreate("L4 line", OBJ_HLINE, 0, Time[40], L4);
      ObjectSet("L4 line", OBJPROP_STYLE, STYLE_DASHDOTDOT);
      ObjectSet("L4 line", OBJPROP_COLOR, Yellow);
      }
      else
      {
      ObjectMove("L4 line", 0, Time[40], L4);
      }
   }
//-------End of Draw Camarilla Lines

//------ Midpoints Pivots

   if (midpivots==true)
   {

      if(ObjectFind("M5 label") != 0)
      {
      ObjectCreate("M5 label", OBJ_TEXT, 0, Time[20], M5);
      ObjectSetText("M5 label", " M5", 8, "Arial", Yellow);
      }
      else
      {
      ObjectMove("M5 label", 0, Time[20], M5);
      }

      if(ObjectFind("M4 label") != 0)
      {
      ObjectCreate("M4 label", OBJ_TEXT, 0, Time[20], M4);
      ObjectSetText("M4 label", " M4", 8, "Arial", Yellow);
      }
      else
      {
      ObjectMove("M4 label", 0, Time[20], M4);
      }

      if(ObjectFind("M3 label") != 0)
      {
      ObjectCreate("M3 label", OBJ_TEXT, 0, Time[20], M3);
      ObjectSetText("M3 label", " M3", 8, "Arial", Yellow);
      }
      else
      {
      ObjectMove("M3 label", 0, Time[20], M3);
      }

      if(ObjectFind("M2 label") != 0)
      {
      ObjectCreate("M2 label", OBJ_TEXT, 0, Time[20], M2);
      ObjectSetText("M2 label", " M2", 8, "Arial", Yellow);
      }
      else
      {
      ObjectMove("M2 label", 0, Time[20], M2);
      }

      if(ObjectFind("M1 label") != 0)
      {
      ObjectCreate("M1 label", OBJ_TEXT, 0, Time[20], M1);
      ObjectSetText("M1 label", " M1", 8, "Arial", Yellow);
      }
      else
      {
      ObjectMove("M1 label", 0, Time[20], M1);
      }

      if(ObjectFind("M0 label") != 0)
      {
      ObjectCreate("M0 label", OBJ_TEXT, 0, Time[20], M0);
      ObjectSetText("M0 label", " M0", 8, "Arial", Yellow);
      }
      else
      {
      ObjectMove("M0 label", 0, Time[20], M0);
      }

//---- Draw Midpoint Pivots on Chart
      if(ObjectFind("M5 line") != 0)
      {
      ObjectCreate("M5 line", OBJ_HLINE, 0, Time[40], M5);
      ObjectSet("M5 line", OBJPROP_STYLE, STYLE_DOT);
      ObjectSet("M5 line", OBJPROP_COLOR, Red);
      }
      else
      {
      ObjectMove("M5 line", 0, Time[40], M5);
      }

      if(ObjectFind("M4 line") != 0)
      {
      ObjectCreate("M4 line", OBJ_HLINE, 0, Time[40], M4);
      ObjectSet("M4 line", OBJPROP_STYLE, STYLE_DOT);
      ObjectSet("M4 line", OBJPROP_COLOR, Red);
      }
      else
      {
      ObjectMove("M4 line", 0, Time[40], M4);
      }

      if(ObjectFind("M3 line") != 0)
      {
      ObjectCreate("M3 line", OBJ_HLINE, 0, Time[40], M3);
      ObjectSet("M3 line", OBJPROP_STYLE, STYLE_DOT);
      ObjectSet("M3 line", OBJPROP_COLOR, Red);
      }
      else
      {
      ObjectMove("M3 line", 0, Time[40], M3);
      }

      if(ObjectFind("M2 line") != 0)
      {
      ObjectCreate("M2 line", OBJ_HLINE, 0, Time[40], M2);
      ObjectSet("M2 line", OBJPROP_STYLE, STYLE_DOT);
      ObjectSet("M2 line", OBJPROP_COLOR, Lime);
      }
      else
      {
      ObjectMove("M2 line", 0, Time[40], M2);
      }

      if(ObjectFind("M1 line") != 0)
      {
      ObjectCreate("M1 line", OBJ_HLINE, 0, Time[40], M1);
      ObjectSet("M1 line", OBJPROP_STYLE, STYLE_DOT);
      ObjectSet("M1 line", OBJPROP_COLOR, Lime);
      }
      else
      {
      ObjectMove("M1 line", 0, Time[40], M1);
      }

      if(ObjectFind("M0 line") != 0)
      {
      ObjectCreate("M0 line", OBJ_HLINE, 0, Time[40], M0);
      ObjectSet("M0 line", OBJPROP_STYLE, STYLE_DOT);
      ObjectSet("M0 line", OBJPROP_COLOR, Lime);
      }
      else
      {
      ObjectMove("M0 line", 0, Time[40], M0);
      }
      // Draw Scott Jones H2/L2 fro intraday trend
      if(ObjectFind("SJ-H2") != 0)
      {
      ObjectCreate("SJ-H2", OBJ_HLINE, 0, Time[40], H2);
      ObjectSet("SJ-H2", OBJPROP_STYLE, STYLE_SOLID);
      ObjectSet("SJ-H2", OBJPROP_COLOR,Yellow);
      }
      else
      {
      ObjectMove("SJ-H2", 0, Time[40], H2);
      }
      if(ObjectFind("SJ-L2") != 0)
      {
      ObjectCreate("SJ-L2", OBJ_HLINE, 0, Time[40],L2);
      ObjectSet("SJ-L2", OBJPROP_STYLE, STYLE_SOLID);
      ObjectSet("SJ-L2",OBJPROP_COLOR,Yellow);
      }
      else
      {
      ObjectMove("SJ-L2", 0, Time[40],L2);
      }
      if(ObjectFind("SJ-H2 Label") != 0)
      {
      ObjectCreate("SJ-H2 Label", OBJ_TEXT, 0, Time[20], H2);
      ObjectSetText("SJ-H2 Label", " SJ-H2", 8, "Arial", Yellow);
      }
      else
      {
      ObjectMove("SJ-H2 Label", 0, Time[20],H2);
      }
      if(ObjectFind("SJ-L2 Label") != 0)
      {
      ObjectCreate("SJ-L2 Label", OBJ_TEXT, 0, Time[20], L2);
      ObjectSetText("SJ-L2 Label", " SJ-L2", 8, "Arial", Yellow);
      }
      else
      {
      ObjectMove("SJ-L2 Label", 0, Time[20],L2);
      }
   // find pivots bar on current time chart
   firstbar=Bars-1;
   i=0;found=false;
   while ((i<=firstbar) && (found==false))
   {
    if (TimeMinute(Time[i])==0 && TimeHour(Time[i])-TimeZone==0)
    {vbar=i;found=true;}
    i++;
   }
  VerticalLine("Pivots",vbar,Yellow,"Pivots");
  //----End of Midpoint Pivots Draw
 }
//---- End Of Program
   return(0);
}

//+------------------------------------------------------------------+
int VerticalLine(string objname,int posn,int Col,string s)
{
 double val;
 ObjectDelete(objname);
 ObjectCreate(objname,OBJ_TREND,0,Time[posn],0,Time[posn],999);
 ObjectSet(objname,OBJPROP_COLOR,Col);
 ObjectSet("objname",OBJPROP_WIDTH,1);
 ObjectSet("objname",OBJPROP_STYLE,STYLE_SOLID);
 ObjectSet("PivVL",OBJPROP_RAY,0);
 ObjectDelete(objname+"T");
 val=High[Highest(NULL,0,MODE_HIGH,BarsPerWindow(),0)];
 ObjectCreate(objname+"T",OBJ_TEXT,0,Time[posn+2],val+Point*3);
 ObjectSetText(objname+"T",s,8,"Arial",White);
 return(0);
}
Comments