PCCI_v2
Download script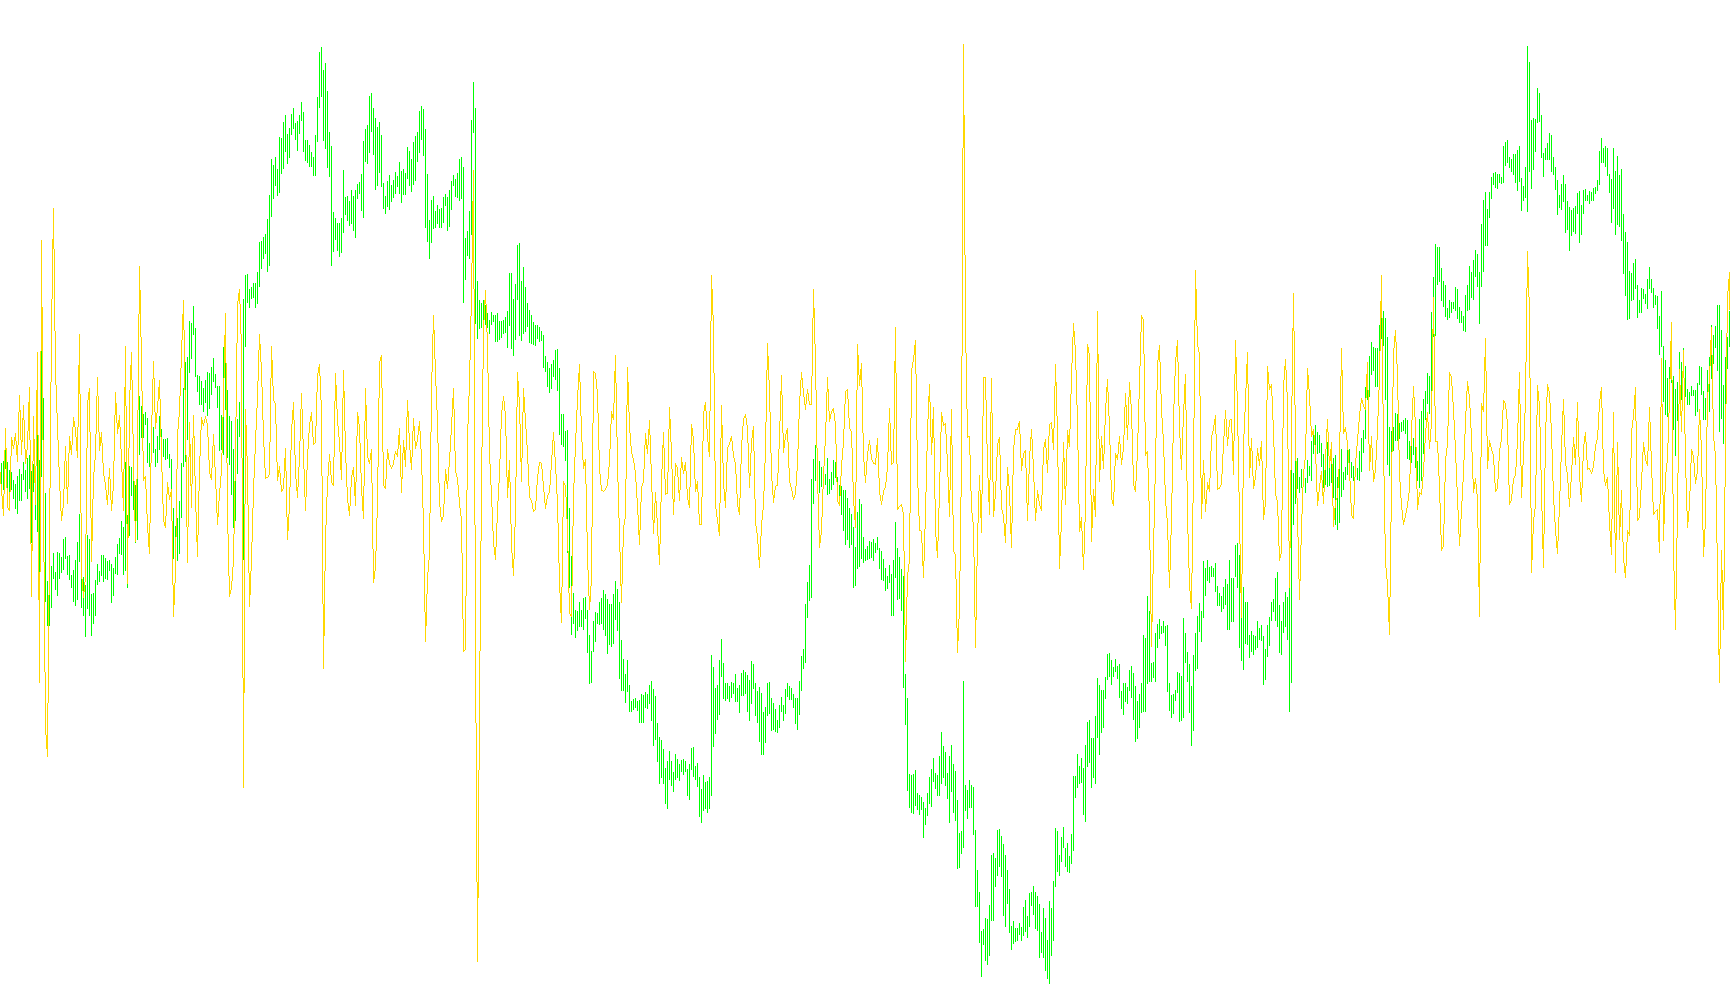
This technical tool is designed to provide traders with a smoothed visualization of market momentum by calculating the relationship between current price action and historical price trends. Instead of simply looking at where the price is right now, this script analyzes a specific window of past data to determine whether the market is behaving in an expected way or deviating from its established pattern.
How the Logic Works
The core functionality of this indicator relies on two main phases: weighted mathematical analysis and real-time deviation tracking.
1. Weighted Historical Analysis The script examines a sequence of 40 preceding data points (price bars). Rather than treating every past price equally, it applies a unique "weight" to each one. Some recent prices are given significant importance (positive weight), while older prices or specific historical marks may be subtracted (negative weight). This creates a complex mathematical average that represents a "theoretical" expectation of where the price should be based on its recent journey.
2. Establishing the Baseline By combining these 40 different weights, the script generates a single value. You can think of this value as a smoothed representation of the market's underlying trend—a "smoothed baseline" that filters out the minor, insignificant noise of minute-to-minute price fluctuations to show the broader direction.
3. Measuring the Deviation The final step in the logic compares the actual current price (calculated as the midpoint between the highest and lowest points of a bar) against the weighted theoretical value calculated in the previous step.
The resulting line plotted on your chart represents this difference. If the gap between the actual price and the mathematical expectation is increasing, it signals a shift in momentum. By watching how this line moves, traders can better identify whether the market is accelerating in a certain direction or if it is beginning to stall out against its historical trend.
Summary for Traders
In simple terms, this script tells you: "Based on the behavior of the last 40 candles, where does the price 'should' be right now?" By plotting the difference between reality and that expectation, it helps traders visualize momentum shifts and potential trend exhaustion more clearly than looking at raw price action alone.
//+------------------------------------------------------------------+
//| PCCI.mq4                                                         |
//|                                                                  |
//+------------------------------------------------------------------+
#property copyright "Copyright 2002, Finware.ru Ltd."
#property link "http://www.finware.ru/"
//----
#property indicator_separate_window
#property indicator_buffers 1
#property indicator_color1 Blue
//---- buffers
double PCCIBuffer[];
//+------------------------------------------------------------------+
//| Custom indicator initialization function                         |
//+------------------------------------------------------------------+
int init()
  {
   string short_name;
//---- indicator line
   SetIndexStyle(0,DRAW_LINE);
   SetIndexBuffer(0,PCCIBuffer);
   SetIndexDrawBegin(0,39);
//----
   return(0);
  }
//+------------------------------------------------------------------+
//| PCCI                                                             |
//+------------------------------------------------------------------+
int start()
  {
   int i,counted_bars=IndicatorCounted();
   double value1;
//----
   if(Bars<=38) return(0);
//---- initial zero
   if(counted_bars<39)
      for(i=1;i<=0;i++) PCCIBuffer[Bars-i]=0.0;
//----
   i=Bars-39-1;
   if(counted_bars>=39) i=Bars-counted_bars-1;
   while(i>=0)
     {
      value1=
      0.36423990*Close[i+0]
      +0.33441085*Close[i+1]
      +0.25372851*Close[i+2]
      +0.14548806*Close[i+3]
      +0.03934469*Close[i+4]
      -0.03871426*Close[i+5]
      -0.07451349*Close[i+6]
      -0.06903411*Close[i+7]
      -0.03611022*Close[i+8]
      +0.00422528*Close[i+9]
      +0.03382809*Close[i+10]
      +0.04267885*Close[i+11]
      +0.03120441*Close[i+12]
      +0.00816037*Close[i+13]
      -0.01442877*Close[i+14]
      -0.02678947*Close[i+15]
      -0.02525534*Close[i+16]
      -0.01272910*Close[i+17]
      +0.00350063*Close[i+18]
      +0.01565175*Close[i+19]
      +0.01895659*Close[i+20]
      +0.01328613*Close[i+21]
      +0.00252297*Close[i+22]
      -0.00775517*Close[i+23]
      -0.01301467*Close[i+24]
      -0.01164808*Close[i+25]
      -0.00527241*Close[i+26]
      +0.00248750*Close[i+27]
      +0.00793380*Close[i+28]
      +0.00897632*Close[i+29]
      +0.00583939*Close[i+30]
      +0.00059669*Close[i+31]
      -0.00405186*Close[i+32]
      -0.00610944*Close[i+33]
      -0.00509042*Close[i+34]
      -0.00198138*Close[i+35]
      +0.00144873*Close[i+36]
      +0.00373774*Close[i+37]
      +0.01047723*Close[i+38]
      -0.00022625*Close[i+39];
//----
      PCCIBuffer[i]=(High[i]+Low[i])/2-value1;
      i--;
     }
   return(0);
  }
//+------------------------------------------------------------------+
Comments