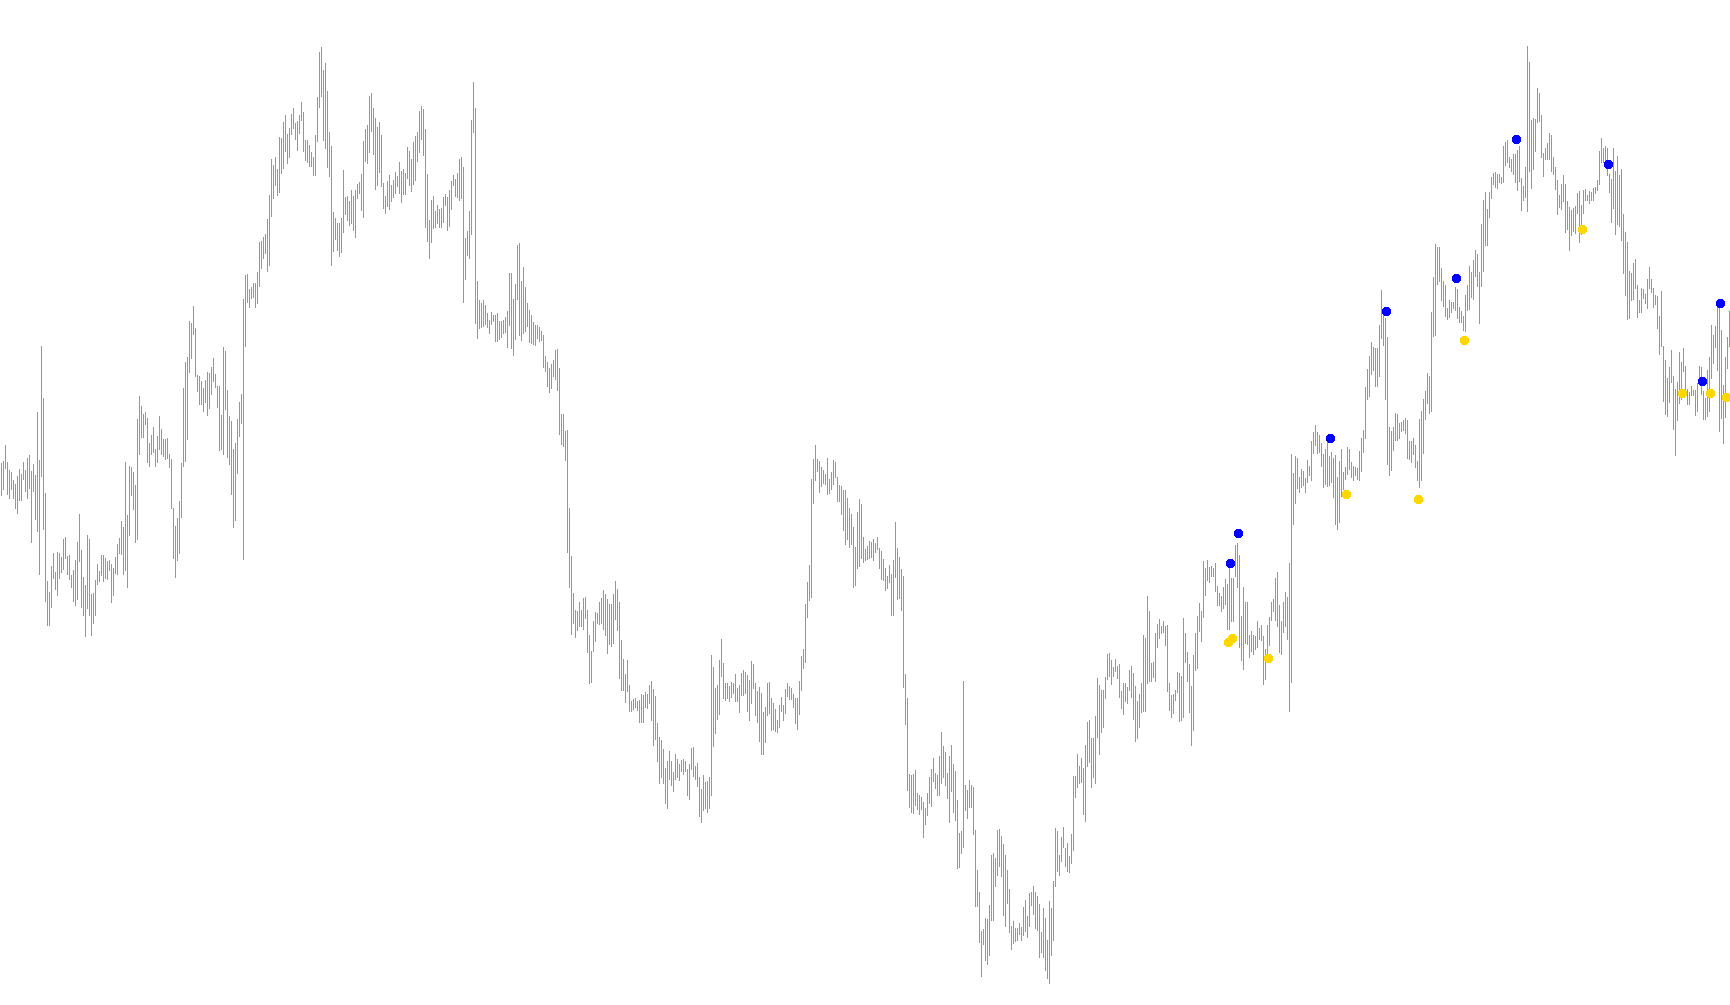
The ASCtrend script is a technical analysis tool designed to identify market trend reversals by analyzing price action and momentum. Rather than relying on simple price movements, the logic focuses on identifying "significant" price shifts relative to recent market volatility.
Core Logic Overview
Volatility-Based Measurement The script begins by calculating the average price range (the difference between the high and low prices) over a rolling 10-bar period. This provides a baseline for "normal" market movement. By establishing this average, the tool can distinguish between standard market noise and aggressive, intentional moves by buyers or sellers.
Significant Movement Detection The script uses two specific criteria to determine if a trend is forming:
- Gap/Jump Analysis: It looks for instances where the price moves significantly more than double the average range within a short period.
- Momentum Acceleration: It checks for rapid price changes that exceed nearly five times the average range over a specific window.
If either of these conditions is met, the script adjusts its sensitivity to recognize that a trend is actively developing.
The Momentum Filter (WPR) To filter out false signals, the logic incorporates a modified Williams %R (WPR) calculation. The WPR is a momentum indicator that measures overbought and oversold conditions. The script transforms this data to monitor how "deep" into an extreme zone the price has moved.
Signal Generation Logic The tool looks for specific "breakout" behaviors to trigger alerts:
- Buy Signals: When the momentum moves from an oversold state toward a neutral zone, the script looks for a specific threshold to be crossed. If the price action confirms a recovery, it triggers a Buy alert.
- Sell Signals: Conversely, when momentum moves from an overbought state back toward the neutral zone, and the price action confirms a downward shift, it triggers a Sell alert.
Summary of Behavior
In plain terms, the script acts as a trend-following filter. It ignores minor fluctuations and only alerts the user when it detects a high-momentum move that is large enough to be considered a meaningful shift in market direction. When these conditions align—specifically when momentum "breaks out" of an extreme zone—the tool places markers on the chart and issues a notification for potential trading opportunities.
/*-----------------------------+
|			       |
| Shared by www.Aptrafx.com    |
|			       |
+------------------------------*/


//+------------------------------------------------------------------+
//|                                                ASCtrend.mq4 |
//|                      Copyright © 2005, MetaQuotes Software Corp. |
//|                                        http://www.metaquotes.net |
//+------------------------------------------------------------------+
#property copyright "Copyright © 2005, MetaQuotes Software Corp."
#property link      "http://www.metaquotes.net"
#property indicator_chart_window
#property indicator_buffers 2
#property indicator_color1 Aqua
#property indicator_color2 Magenta

extern int RISK=4;
extern int AllBars=250;
int up=0,dn=0;
double val1buffer[];
double val2buffer[];
//+------------------------------------------------------------------+
//| Custom indicator initialization function                         |
//+------------------------------------------------------------------+
int init()
  {
//---- indicators
      SetIndexStyle(0,DRAW_ARROW,EMPTY);
      SetIndexArrow(0,108);
      SetIndexBuffer(0, val1buffer);

      SetIndexStyle(1,DRAW_ARROW,EMPTY);
      SetIndexArrow(1,108);
      SetIndexBuffer(1, val2buffer);
      return(0);
  }
//+------------------------------------------------------------------+
//| Custom indicator deinitialization function                       |
//+------------------------------------------------------------------+
int deinit()
   {
     return(0);
   }
//+------------------------------------------------------------------+
//| Custom indicator iteration function                              |
//+------------------------------------------------------------------+
// int    counted_bars=IndicatorCounted();

int start()
{

   double value2;
   double value3;
   double value10=10;
   double value11;
   double x1=70;
   double x2=30;
   int TrueCount;
   int counter;
   int MRO1;
   int MRO2;
   int i1;
   double Range;
   double AvgRange;
   double val1;
   double val2;
   double Table_value2[500][2];
   int counted_bars=IndicatorCounted();

   value10=3+RISK*2;
   x1=67+RISK;
   x2=33-RISK;
   value11=value10;
  //----------------------------

   if(counted_bars<0) return (-1);
   if(counted_bars>0) counted_bars--;       //last bar recounted
   int i;
   int shift = Bars-counted_bars-1;
   if (shift > AllBars) shift = AllBars;

  for(i=shift; i>0; i--)
   {


      counter=i;
      Range=0;
      AvgRange=0;
      for (counter=i ;counter<=i+9;counter++)
      {
         AvgRange=AvgRange+MathAbs(High[counter]-Low[counter]);
      }
      Range=AvgRange/10;


      counter=i;
      TrueCount=0;
      while (counter<i+9 && TrueCount<1)
      {
         if (MathAbs(Open[counter]-Close[counter+1])>=Range*2.0 )
               TrueCount++;
         counter++;
      }

      if (TrueCount>=1)
            MRO1=counter ;
      else
            MRO1=-1;

      counter=i;
      TrueCount=0;
      while (counter<i+6 && TrueCount<1)
      {
           if(MathAbs(Close[counter+3]-Close[counter])>=Range*4.6)
            {TrueCount++;}
           counter++;
      }

      if(TrueCount>=1)
            MRO2=counter;
      else
            MRO2=-1;

      if (MRO1>-1)
            value11=3;
      else
            value11=value10;

      if (MRO2>-1)
            value11=4;
      else
           value11=value10;


      value2=100-MathAbs(iWPR(NULL,0,value11,i));
      Table_value2[i][0]=i;
      Table_value2[i][1]=value2;
      val1=0;
      val2=0;
      value3=0;
      //-------------------     val1
      if (value2<x2 )  //  x2 = 30
      {
         i1=1;
         while (Table_value2[i+i1][1]>=x2 && Table_value2[i+i1][1]
<=x1)
         {i1++;}

         if (Table_value2[i+i1][1]>x1)
         {
            value3=High[i]+Range*0.5;
            val1=value3;
         }
      }

      //-------------------     val2
      if ( value2>x1) // x1 = 70
      {
            i1=1;
            while (Table_value2[i+i1][1]>=x2 && Table_value2[i+i1][1]
<=x1)
            {i1++;}

            if (Table_value2[i+i1][1]< x2)
            {
               value3=Low[i]-Range*0.5;
               val2=value3;
            }
      }


      if (val2!=0 && up==0 )
      {
           val1buffer[i]= val2-1*Point;
           up=1;
           dn=0;
           if(shift<=2)
           {
            Alert (Symbol(),"Asctrend BUY ");
            }
      }
      if (val1 !=0 && dn==0)
      {

            val2buffer[i]= val1+1*Point;
            dn=1;
            up=0;
            if(shift<=2)
            {
            Alert (Symbol(),"Asctrend SELL ");
            }
       }

   }
return(0);

}
Comments