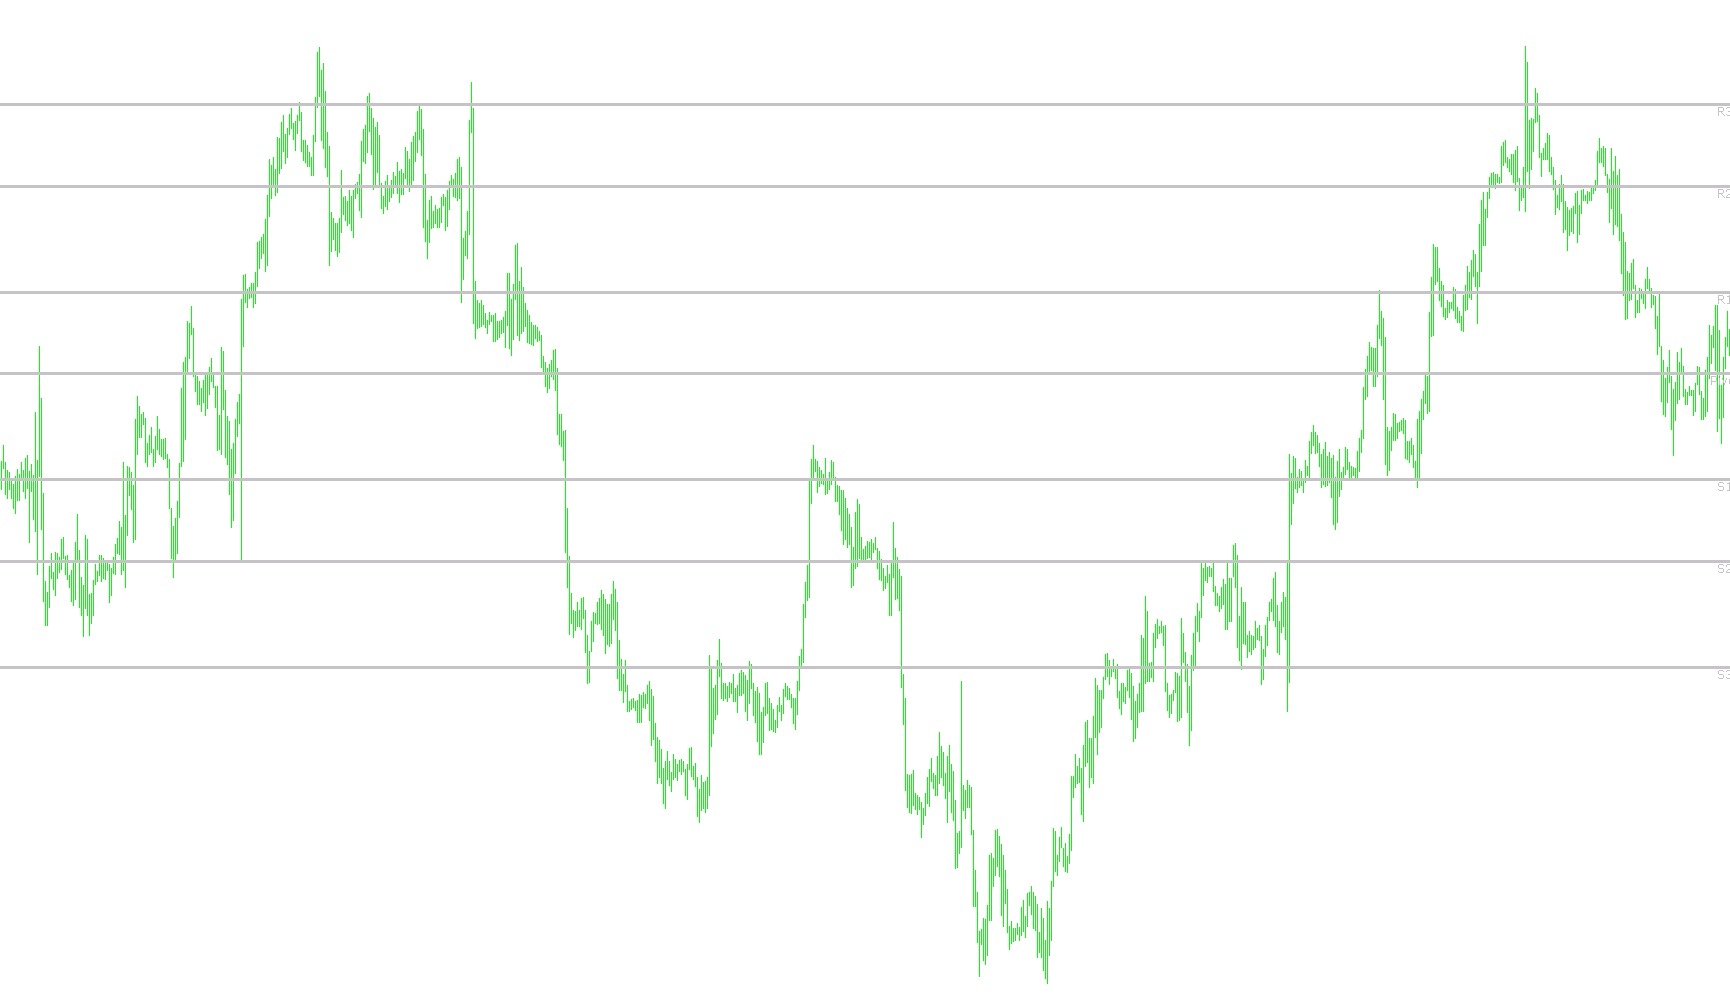
This script is a specialized financial tool designed to automatically calculate and display key market levels known as "Pivots." These levels are widely used by traders to identify potential areas of support (where price might stop falling) and resistance (where price might stop rising).
Core Functionality
The primary purpose of this script is to take historical price data from previous trading sessions and project specific horizontal lines onto your current chart. These lines help visualize the "floor" and "ceiling" of the market based on the previous day's activity.
How the Logic Works
1. Data Collection and Intelligence The script intelligently scans the market history to find the essential data points from the previous trading day: the High price, the Low price, and the Closing price. It includes a specific logic bridge to handle weekends; if the most recent completed session was a Sunday or if it's currently Monday, the script can look back to ensure it pulls data from the last valid Friday session.
2. The Pivot Calculations Once the script has gathered the previous day's High, Low, and Close prices, it performs a series of mathematical operations to generate seven distinct levels:
- The Pivot Point (P): The central equilibrium point of the previous day’s price action.
- Resistance Levels (R1, R2, R3): These represent targets or "ceilings" above the pivot point. The higher the number, the further away the resistance level is from the current price.
- Support Levels (S1, S2, S3): These represent "floors" below the pivot point. The higher the number, the deeper the potential support zone.
3. Visual Representation Instead of just providing raw numbers in a text window, the script dynamically draws these levels directly onto your trading chart as solid horizontal lines.
- Automatic Updates: It continuously refreshes these lines to ensure they stay accurate to the current market session.
- Clear Labeling: Each line is clearly marked with a text label (e.g., "R1", "S2", "Pivot") so you can instantly identify which level is which without confusion.
- Visual Style: The lines are rendered in a consistent silver color with specific thickness settings to ensure they are visible but do not clutter your view of the price action.
Summary for the User
By using this script, you eliminate the manual math required to calculate daily pivots. It automatically analyzes the previous day's performance and draws a complete map of support and resistance levels on your screen, allowing you to see where the market is likely to face pressure or find stability in real-time.
//+------------------------------------------------------------------+
//|           Included is the PRICE based Pivot calculator           |
//|                (Daily Pivot,R1,R2,R3 & S1,S2,S3)                 |
//|                                                                  |
//|                                 Email: Xard777@connectfree.co.uk |
//+------------------------------------------------------------------+
#property copyright ""
#property link      ""
#property indicator_chart_window


extern int P = 5; //How many days back /0 = curr day/ 1 = yesterday/ 2= 2days ago

//---- input parameters ----
int fontsize = 10;
double LastHigh, LastLow, x;

//+------------------------------------------------------------------+
//| Custor indicator deinitialization function                       |
//+------------------------------------------------------------------+
int deinit()
  {
  ObjectsDeleteAll();
//----
   return(0);
  }
//+------------------------------------------------------------------+
//| Custom indicator initialization function                         |
//+------------------------------------------------------------------+
int init()
  {


//---- Name for DataWindow and indicator subwindow label
   IndicatorShortName("XA");
   SetIndexDrawBegin(0,1);
   IndicatorDigits(MarketInfo(Symbol(),MODE_DIGITS));

   return(0);
  }

//+------------------------------------------------------------------+
//| Custom indicator iteration function                              |
//+------------------------------------------------------------------+
int start()
{

  //{
   int counted_bars = IndicatorCounted();
   int limit, i;

//---- Indicator Calculation ----
   if(counted_bars == 0)
     {
       x = Period();
       if(x > 240)
           return(-1);
     }
   if(counted_bars < 0)
       return(-1);
   //---- last counted bar will be recounted
   //   if(counted_bars>0) counted_bars--;
      limit = (Bars - counted_bars) - 1;
//----
   for(i = limit; i >= 0; i--)
     {
       if(High[i+1] > LastHigh)
           LastHigh = High[i+1];
       //----
       if(Low[i+1] < LastLow)
           LastLow=Low[i+1];
       if(TimeDay(Time[i]) != TimeDay(Time[i+1]))
         {

           LastLow = Open[i];
           LastHigh = Open[i];

         }

//---- Pivot Setup ----
double rates[1][6],yesterday_volume,yesterday_close,yesterday_high,yesterday_low,yesterday_open;
ArrayCopyRates(rates, Symbol(), PERIOD_D1);

if(DayOfWeek() == 1)
{
   if(TimeDayOfWeek(iTime(Symbol(),PERIOD_D1,1)) == 5)
   {
       yesterday_volume = rates[1][5];
       yesterday_close = rates[1][4];
       yesterday_high = rates[1][3];
       yesterday_low = rates[1][2];
       yesterday_open = rates[1][1];

   }
   else
   {
      for(int d = 5;d>=0;d--)
      {
         if(TimeDayOfWeek(iTime(Symbol(),PERIOD_D1,d)) == 5)
         {
             yesterday_volume = rates[d][5];
             yesterday_close = rates[d][4];
             yesterday_high = rates[d][3];
             yesterday_low = rates[d][2];
             yesterday_open = rates[d][1];
         }

      }

   }
}
else
{
    yesterday_close = rates[1][4];
    yesterday_high = rates[1][3];
    yesterday_low = rates[1][2];
    yesterday_open = rates[1][1];
}

//---- Calculate Pivots ----
double R = yesterday_high - yesterday_low;//range
double p = (yesterday_high + yesterday_low + yesterday_close)/3;// Standard Pivot
double r3 = (2*p)+(yesterday_high-(2*yesterday_low));// Resistance 3
double r2 = p+(yesterday_high - yesterday_low);// Resistance point 2
double r1 = (2*p)-yesterday_low;// Resistance point 1
double s1 = (2*p)-yesterday_high;// Support point 1
double s2 = p-(yesterday_high - yesterday_low);// Support point 2
double s3 = (2*p)-((2* yesterday_high)-yesterday_low);// Support point 3

//Pivot, Support & Resistance Lines
ObjectDelete("p_Line");
ObjectCreate("p_Line", OBJ_HLINE,0, CurTime(),p);
ObjectSet("p_Line",OBJPROP_COLOR,Silver);
ObjectSet("p_Line",OBJPROP_STYLE,STYLE_SOLID);
ObjectSet("p_Line",OBJPROP_WIDTH,3);

ObjectDelete("r1_Line");
ObjectCreate("r1_Line", OBJ_HLINE,0, CurTime(),r1);
ObjectSet("r1_Line",OBJPROP_COLOR,Silver);
ObjectSet("r1_Line",OBJPROP_STYLE,STYLE_SOLID);
ObjectSet("r1_Line",OBJPROP_WIDTH,3);

ObjectDelete("r2_Line");
ObjectCreate("r2_Line", OBJ_HLINE,0, CurTime(),r2);
ObjectSet("r2_Line",OBJPROP_COLOR,Silver);
ObjectSet("r2_Line",OBJPROP_STYLE,STYLE_SOLID);
ObjectSet("r2_Line",OBJPROP_WIDTH,3);

ObjectDelete("r3_Line");
ObjectCreate("r3_Line", OBJ_HLINE,0, CurTime(),r3);
ObjectSet("r3_Line",OBJPROP_COLOR,Silver);
ObjectSet("r3_Line",OBJPROP_STYLE,STYLE_SOLID);
ObjectSet("r3_Line",OBJPROP_WIDTH,3);

ObjectDelete("s1_Line");
ObjectCreate("s1_Line", OBJ_HLINE,0, CurTime(),s1);
ObjectSet("s1_Line",OBJPROP_COLOR,Silver);
ObjectSet("s1_Line",OBJPROP_STYLE,STYLE_SOLID);
ObjectSet("s1_Line",OBJPROP_WIDTH,3);

ObjectDelete("s2_Line");
ObjectCreate("s2_Line", OBJ_HLINE,0, CurTime(),s2);
ObjectSet("s2_Line",OBJPROP_COLOR,Silver);
ObjectSet("s2_Line",OBJPROP_STYLE,STYLE_SOLID);
ObjectSet("s2_Line",OBJPROP_WIDTH,3);

ObjectDelete("s3_Line");
ObjectCreate("s3_Line", OBJ_HLINE,0, CurTime(),s3);
ObjectSet("s3_Line",OBJPROP_COLOR,Silver);
ObjectSet("s3_Line",OBJPROP_STYLE,STYLE_SOLID);
ObjectSet("s3_Line",OBJPROP_WIDTH,3);

ObjectsRedraw();

// ---- Typing Labels ----

//R3 Label
if(ObjectFind("R3 label") != 0)
{
ObjectCreate("R3 label", OBJ_TEXT, 0, Time[3], r3);
ObjectSetText("R3 label", " R3 ", 9, "Verdana", Silver);
}
else
{
ObjectMove("R3 label", 0, Time[3], r3);
}

//S3 Label
if(ObjectFind("S3 label") != 0)
{
ObjectCreate("S3 label", OBJ_TEXT, 0, Time[3], s3);
ObjectSetText("S3 label", " S3 ", 9, "Verdana", Silver);
}
else
{
ObjectMove("S3 label", 0, Time[3], s3);
}

//R2 Label
if(ObjectFind("R2 label") != 0)
{
ObjectCreate("R2 label", OBJ_TEXT, 0, Time[3], r2);
ObjectSetText("R2 label", " R2 ", 9, "Verdana", Silver);
}
else
{
ObjectMove("R2 label", 0, Time[3], r2);
}

//S2 Label
if(ObjectFind("S2 label") != 0)
{
ObjectCreate("S2 label", OBJ_TEXT, 0, Time[3], s2);
ObjectSetText("S2 label", " S2 ", 9, "Verdana", Silver);
}
else
{
ObjectMove("S2 label", 0, Time[3], s2);
}

//R1 Label
if(ObjectFind("R1 label") != 0)
{
ObjectCreate("R1 label", OBJ_TEXT, 0, Time[3], r1);
ObjectSetText("R1 label", " R1 ", 9, "Verdana", Silver);
}
else
{
ObjectMove("R1 label", 0, Time[3], r1);
}

//S1 Label
if(ObjectFind("S1 label") != 0)
{
ObjectCreate("S1 label", OBJ_TEXT, 0, Time[3], s1);
ObjectSetText("S1 label", " S1 ", 9, "Verdana", Silver);
}
else
{
ObjectMove("S1 label", 0, Time[3], s1);
}

//Pivot Label
if(ObjectFind("P label") != 0)
{
ObjectCreate("P label", OBJ_TEXT, 0, Time[3], p);
ObjectSetText("P label", " Pivot ", 9, "Verdana", Silver);
}
else
{
ObjectMove("P label", 0, Time[3], p);
}

Comment("Pivot Calculator ");

}

   return(0);

  }
//Job Done
//+------------------------------------------------------------------+
Comments