Pivot_ESAZ_Week
Download script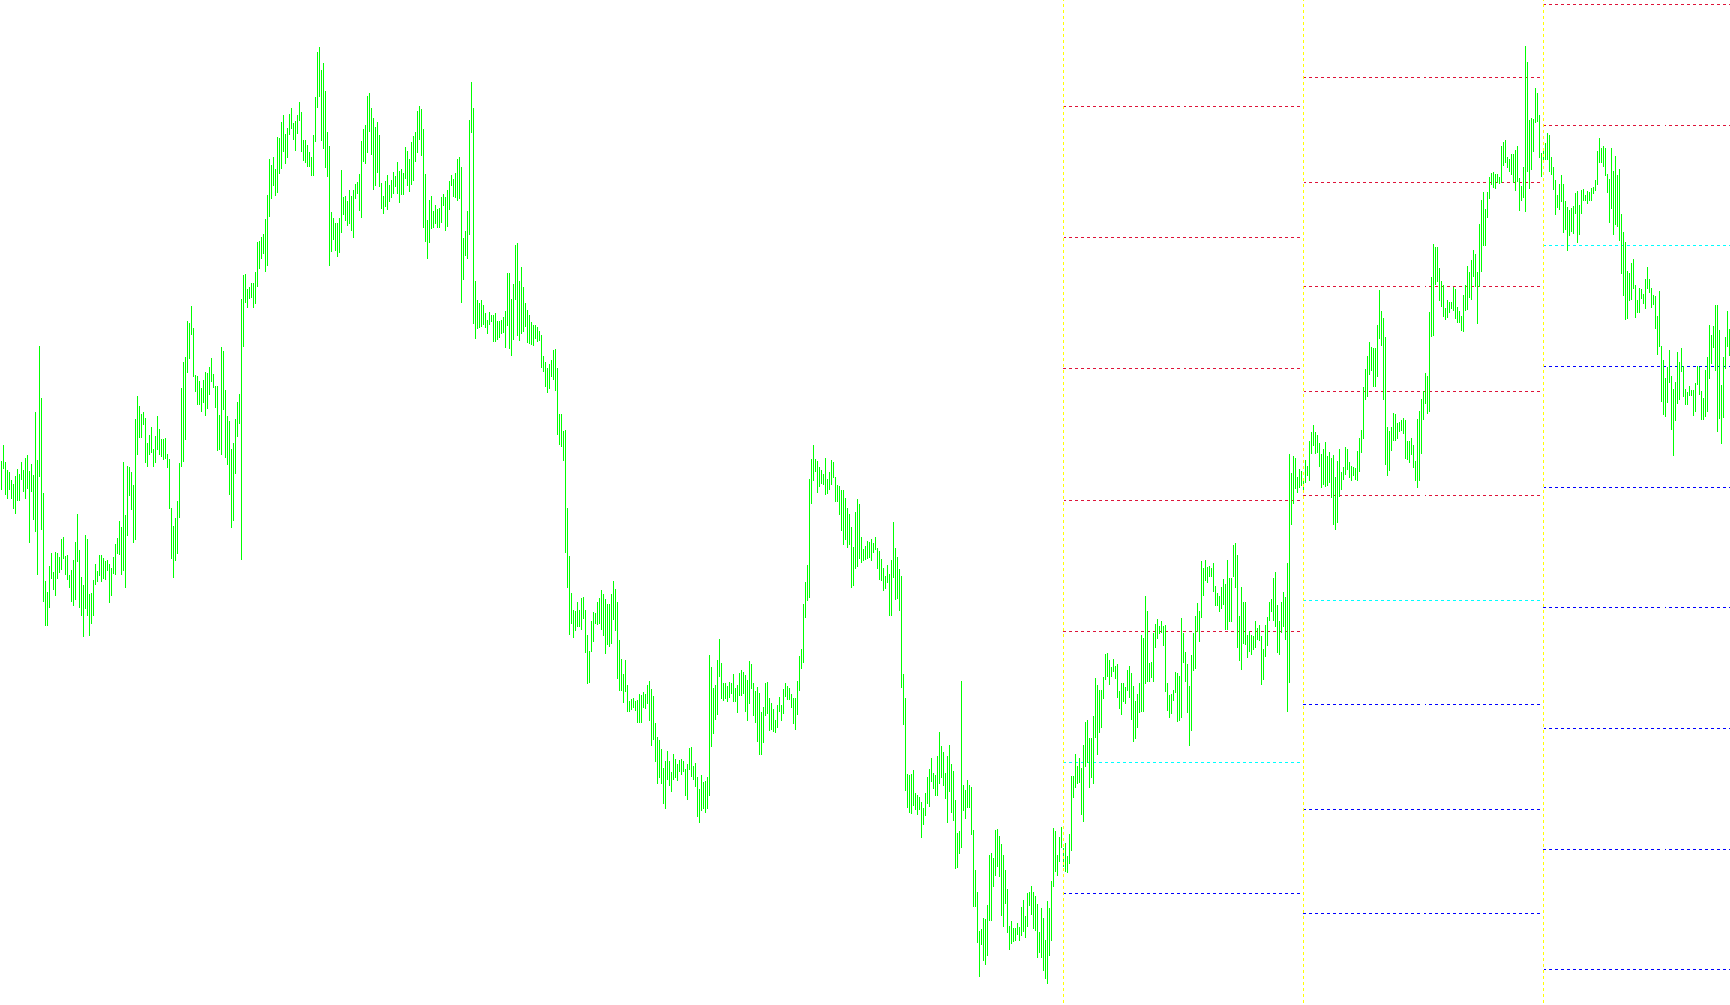
This script is designed to automatically calculate and display key price levels on your trading chart based on weekly historical data. It uses a methodology known as "Pivot Points," which are specific price coordinates used by traders to identify potential areas of support, resistance, and balance in the market.
Core Functionality
The script analyzes the high, low, and closing prices from previous weeks to project several types of technical lines onto your current chart. By visualizing these levels, it helps traders see where price action might stall or reverse based on past behavior.
Key Components Explained
1. Pivot Point Calculations The script identifies a central "Pivot" price for each week. From this center point, it calculates:
- Resistance Levels (R1 - R4): These represent price ceilings where the market may face selling pressure or struggle to move higher.
- Support Levels (S1 - S4): These represent price floors where the market may find buying interest or struggle to drop further.
2. Intermediate "Sub-Levels" Beyond the primary support and resistance lines, the script calculates extra intermediate points between the main levels (labeled as P levels). These provide a more granular view of the price action, identifying smaller "steps" within the larger zones.
3. Grid Zones (GL Lines) The tool draws a series of connecting lines that bridge the gaps between various pivot points. These create a visual "grid" or "web" on your chart. This helps in identifying equilibrium zones—areas where the price is balanced between two significant levels.
4. Historical Visibility Rather than just showing you the current week, the script allows you to view several previous weeks of data simultaneously (based on a user-defined count). This allows you to see how historical levels align with current market movement.
5. Visual Indicators
- Vertical Lines: The script marks specific time boundaries to help distinguish between different weekly periods clearly.
- Color Coding: Different price levels are assigned distinct colors (such as Aqua for the Pivot, Crimson for Resistance, and Blue for Support) to make it easy to read at a glance.
How it Works in Practice
Every time the chart refreshes, the script automatically cleans up old drawings and recalculates the lines based on the most recent weekly data. It ensures that your chart remains organized and updated without requiring manual calculations or constant repositioning of lines by the user.
//+------------------------------------------------------------------+
//|                                              Pivot_ESAZ_Week.mq4 |
//|                                                        DimDimych |
//|                            http://goodservice.su/forum/25-3550-1 |
//+------------------------------------------------------------------+
#property copyright "DimDimych"
#property link      "http://goodservice.su/forum/25-3550-1"

#property indicator_chart_window


extern int   CountPeriods  =3;

extern color pivot         =Aqua;
extern color day           =Yellow;
extern color level_up      =Crimson;
extern color level_dn      =Blue;
extern color setka         =White;
extern color metka         =MidnightBlue;
extern int   LineWidth     =0;
extern int   style         =2;
extern bool  ExtSave       =false;

   datetime ny_time[];
   datetime time1;
   datetime time2;
   double open,close,high,low;
   double P,R1,R2,R3,S1,S2,S3,R4,S4;
   int shift;
//*************
void ObjDel()
{
  for (int num=0;num<=CountPeriods;num++)
  {
  ObjectDelete("PPwk["+num+"]");
  ObjectDelete("R1wk["+num+"]");
  ObjectDelete("R2wk["+num+"]");
  ObjectDelete("R3wk["+num+"]" );
  ObjectDelete("R4wk["+num+"]" );
  ObjectDelete("S1wk["+num+"]" );
  ObjectDelete("S2wk["+num+"]" );
  ObjectDelete("S3wk["+num+"]" );
  ObjectDelete("S4wk["+num+"]" );

  ObjectDelete("R1Pwk["+num+"]");
  ObjectDelete("R2Pwk["+num+"]");
  ObjectDelete("R3Pwk["+num+"]" );
  ObjectDelete("R4Pwk["+num+"]" );
  ObjectDelete("S1Pwk["+num+"]" );
  ObjectDelete("S2Pwk["+num+"]" );
  ObjectDelete("S3Pwk["+num+"]" );
  ObjectDelete("S4Pwk["+num+"]" );

  ObjectDelete("GL1wk["+num+"]");
  ObjectDelete("GL2wk["+num+"]");
  ObjectDelete("GL3wk["+num+"]");
  ObjectDelete("GL4wk["+num+"]");
  ObjectDelete("GL5wk["+num+"]");
  ObjectDelete("GL6wk["+num+"]");
  ObjectDelete("GL7wk["+num+"]");
  ObjectDelete("GL8wk["+num+"]");
  ObjectDelete("GL9wk["+num+"]");
  ObjectDelete("GL10wk["+num+"]");
  ObjectDelete("GL11wk["+num+"]");
  ObjectDelete("GL12wk["+num+"]");
  ObjectDelete("GL13wk["+num+"]");
  ObjectDelete("GL14wk["+num+"]");
  ObjectDelete("GL15wk["+num+"]");
  ObjectDelete("GL16wk["+num+"]");
  ObjectDelete("pVwk["+num+"]");
  }
  ObjectDelete("pVwk0");
}
//***************
void PlotLine(string name,double value,double value1,double line_color)
{
   double valueN=NormalizeDouble(value,Digits);
   double valueN1=NormalizeDouble(value1,Digits);
   bool res = ObjectCreate(name,OBJ_TREND,0,time1,valueN,time2,valueN1);
   ObjectSet(name, OBJPROP_WIDTH, 1);
   ObjectSet(name, OBJPROP_STYLE, style);
   ObjectSet(name, OBJPROP_RAY, false);
   ObjectSet(name, OBJPROP_BACK, true);
   ObjectSet(name, OBJPROP_COLOR, line_color);
}
//***************
void PlotVLine(string name,double tm)
{

   bool res = ObjectCreate(name,OBJ_VLINE,0,tm,0);
   ObjectSet(name, OBJPROP_WIDTH, 0);
   ObjectSet(name, OBJPROP_STYLE, 2);
   ObjectSet(name, OBJPROP_COLOR, day);
}
//***********
int init()
  {
  return(0);
  }
//***************
int deinit()
  {
   ObjDel();
   Comment("");
   return(0);
  }
//***************
int start()
  {
  int i;

  ObjDel();
    string save="";
    if(ExtSave==true)
    {
      save=TimeToStr(TimeLocal(),TIME_DATE|TIME_SECONDS);
    }
  ArrayResize(ny_time,CountPeriods+1);
  for (shift=0;shift<=CountPeriods-1;shift++)
  {
  ny_time[shift]=iTime(NULL,PERIOD_W1,shift);

  high  = iHigh(NULL,PERIOD_W1,shift+1);
  low   = iLow(NULL,PERIOD_W1,shift+1);
  open  = iOpen(NULL,PERIOD_W1,shift+1);
  close = iClose(NULL,PERIOD_W1,shift+1);

  P  = (high+low+close)/3.0;

  R1 = P+(high-low)/2;
  R2 = P+(high-low);
  R3 = P+(high-low)+(high-low)/2;
  R4 = P+(high-low)*2;

  S1 = P-(high-low)/2;
  S2 = P-(high-low);
  S3 = P-(high-low)-(high-low)/2;
  S4 = P-(high-low)*2;
//********
  time1 = ny_time[shift]+1440*60;

  if (shift==0)
  {
  time2 = ny_time[shift] + 8640*60 ;
  PlotVLine("pVwk0"+save,time2);
  }
  else
  time2 = ny_time[shift-1]+1440*60;
//********
   PlotVLine("pVwk["+shift+"]"+save,time1);

   PlotLine("PPwk["+shift+"]"+save,P ,P, pivot);

   PlotLine("R1wk["+shift+"]"+save,R1,R1,level_up);
   PlotLine("R2wk["+shift+"]"+save,R2,R2,level_up);
   PlotLine("R3wk["+shift+"]"+save,R3,R3,level_up);
   PlotLine("R4wk["+shift+"]"+save,R4,R4,level_up);

   PlotLine("R1Pwk["+shift+"]"+save,P+(R1-P)/2,   P+(R1-P)/2,level_up);
   PlotLine("R2Pwk["+shift+"]"+save,R1+(R2-R1)/2,R1+(R2-R1)/2,level_up);
   PlotLine("R3Pwk["+shift+"]"+save,R2+(R3-R2)/2,R2+(R3-R2)/2,level_up);
   PlotLine("R4Pwk["+shift+"]"+save,R3+(R4-R3)/2,R3+(R4-R3)/2,level_up);

   PlotLine("S1wk["+shift+"]"+save,S1,S1,level_dn);
   PlotLine("S2wk["+shift+"]"+save,S2 ,S2,level_dn);
   PlotLine("S3wk["+shift+"]"+save,S3 ,S3,level_dn);
   PlotLine("S4wk["+shift+"]"+save,S4,S4,level_dn);

   PlotLine("S1Pwk["+shift+"]"+save,P- (P-S1)/2,  P-(P-S1)/2,level_dn);
   PlotLine("S2Pwk["+shift+"]"+save,S1-(S1-S2)/2,S1-(S1-S2)/2,level_dn);
   PlotLine("S3Pwk["+shift+"]"+save,S2-(S2-S3)/2,S2-(S2-S3)/2,level_dn);
   PlotLine("S4Pwk["+shift+"]"+save,S3-(S3-S4)/2,S3-(S3-S4)/2,level_dn);
//**************
   PlotLine("GL1wk["+shift+"]"+save,P, R1,setka);
   PlotLine("GL2wk["+shift+"]"+save,R1,R2,setka);
   PlotLine("GL3wk["+shift+"]"+save,R2,R3,setka);
   PlotLine("GL4wk["+shift+"]"+save,R3,R4,setka);

   PlotLine("GL5wk["+shift+"]"+save,R1, P,setka);
   PlotLine("GL6wk["+shift+"]"+save,R2, R1,setka);
   PlotLine("GL7wk["+shift+"]"+save,R3, R2,setka);
   PlotLine("GL8wk["+shift+"]"+save,R4, R3,setka);

   PlotLine("GL9wk["+shift+"]"+save, P, S1,setka);
   PlotLine("GL10wk["+shift+"]"+save,S1,S2,setka);
   PlotLine("GL11wk["+shift+"]"+save,S2,S3,setka);
   PlotLine("GL12wk["+shift+"]"+save,S3,S4,setka);

   PlotLine("GL13wk["+shift+"]"+save,S1, P,setka);
   PlotLine("GL14wk["+shift+"]"+save,S2, S1,setka);
   PlotLine("GL15wk["+shift+"]"+save,S3, S2,setka);
   PlotLine("GL16wk["+shift+"]"+save,S4, S3,setka);
  }
   return(0);
  }
//+------------------------------------------------------------------+
Comments