Pivot_Mid_Support_Historical
Download script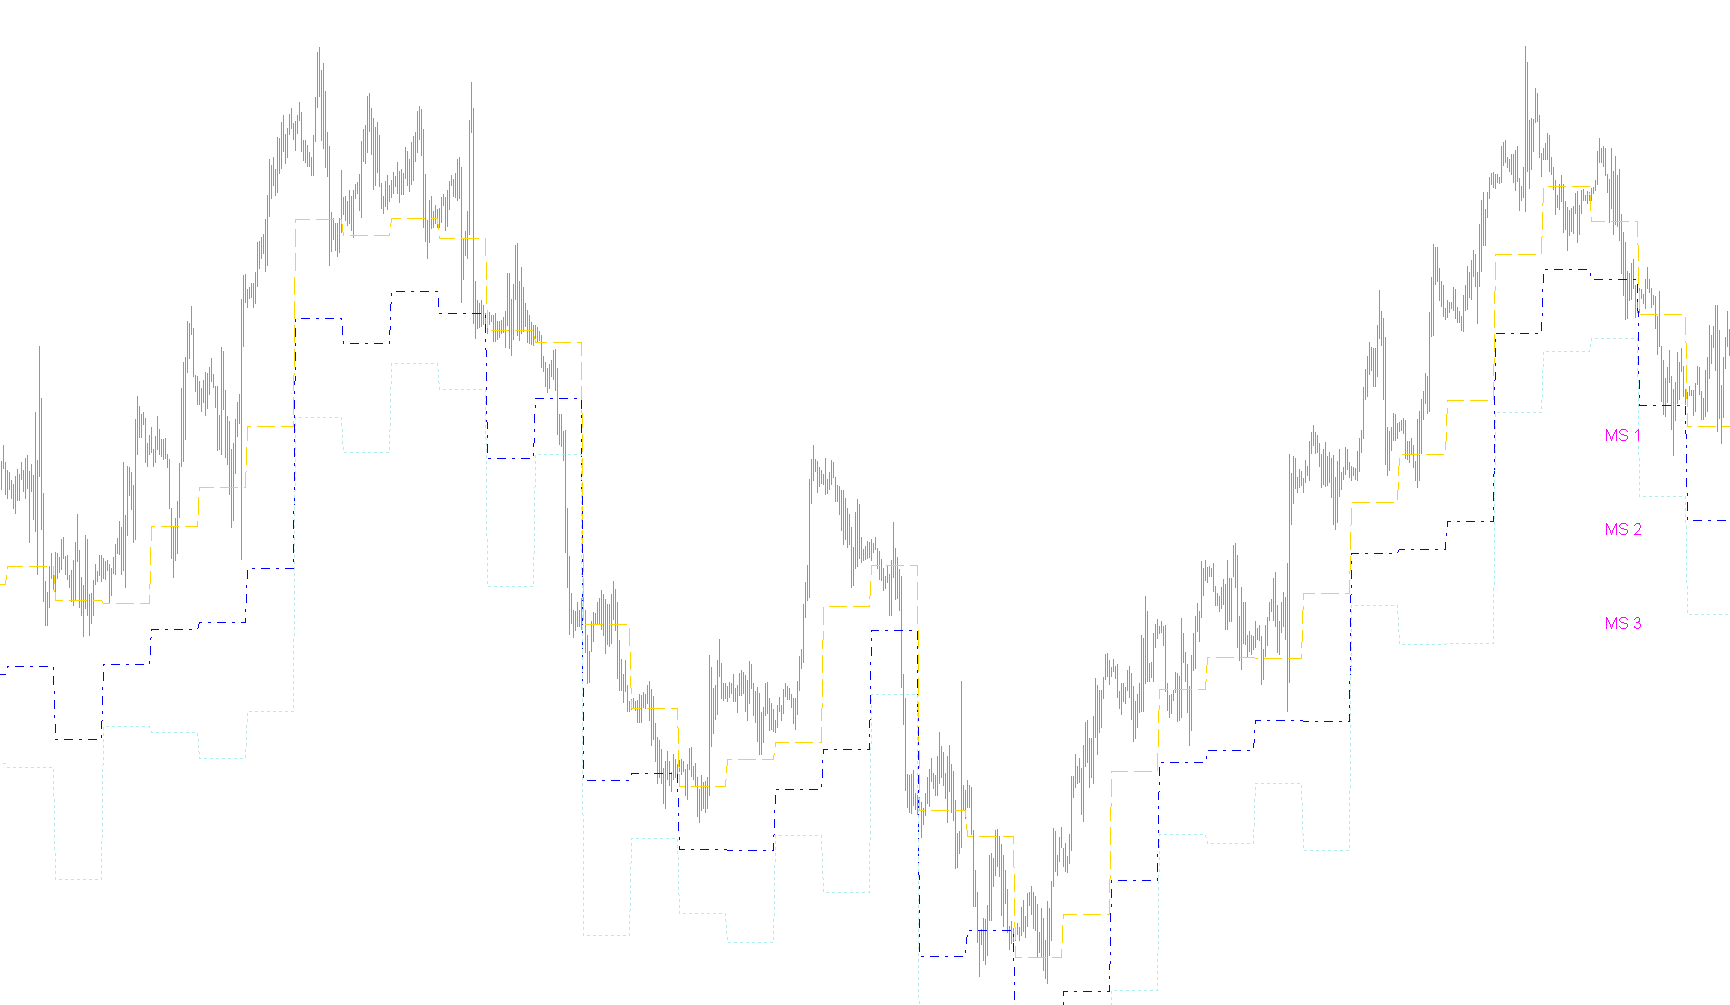
This script is a specialized technical analysis tool designed for the MetaTrader 4 platform. Its primary purpose is to automatically calculate and project historical "Mid Pivot" support and resistance levels onto your trading charts. By identifying these key price points, it helps traders visualize potential areas where the market might encounter significant supply or demand.
Core Logic and Functionality
Timeframe Compatibility To ensure the accuracy of its calculations, the script is designed to operate on shorter timeframes—specifically, any chart period of 4 hours or less. If you attempt to apply it to a larger timeframe (like a daily or weekly chart), the tool will notify you with an alert that the data may not be suitable for this specific analysis.
Daily Price Tracking The logic operates on a day-by-day cycle. The script scans historical price data to identify the high, low, and closing prices of previous trading sessions. It is programmed to handle the nuances of market transitions, including correctly identifying the start of new days and managing the gap between weekend and weekday markets.
The Calculation Process For every new trading day, the script performs a multi-step mathematical sequence based on the previous day's performance:
- Base Pivot Calculation: It first establishes a standard "Pivot" point by averaging the previous day's high, low, and closing prices.
- Support Level Identification: Using that base pivot, it calculates three primary support levels (S1, S2, and S3).
- Mid Pivot Generation: The unique feature of this script is that it doesn't just show the standard support levels; it calculates the "Mid" points between those levels. It generates three specific lines (MS1, MS2, and MS3) which represent the halfway marks between the calculated pivots.
Visual Representation The tool translates these complex mathematical results into visual cues on your screen:
- Dynamic Drawing: The script automatically plots three distinct lines on the chart using different dashed and dotted styles to distinguish between the three Mid Pivot levels.
- Real-Time Labeling: To make the chart easy to read at a glance, the script generates text labels (MS1, MS2, and MS3) that move along with the current price action, clearly identifying which line is which as the market evolves throughout the day.
Summary for the User
Essentially, this tool removes the manual work of calculating complex daily pivot points. It looks at what happened yesterday to predict where the "middle ground" might be today, drawing clear, labeled boundaries on your chart to help you identify potential zones of interest for your trading strategy.
//+------------------------------------------------------------------+
//|                              Pivot Mid Support Historical_V1.mq4 |
//|                      Copyright © 2005, MetaQuotes Software Corp. |
//|                                        http://www.metaquotes.net |
//| Modified to chart historical camarilla pivots by MrPip           |
//| 3/28/06 Fixed problem of Sunday/Monday pivots                    |
//|         and added some ideas from goodtiding5 (Kenneth Z.)       |
//| Modified from Cam historical to plot Mid pivots by Tradex4x      |
//+------------------------------------------------------------------+
#property copyright "Copyright © 2005, MetaQuotes Software Corp."
#property link      "http://www.metaquotes.net"
//----
#property indicator_chart_window
#property indicator_buffers 3
#property indicator_color1 Magenta
#property indicator_color2 Magenta
#property indicator_color3 Magenta
//---- input parameters
extern int  GMTshift=0;
extern color LColor=Magenta;
extern int fontsize=12;
extern int LabelShift=40;
//----
double MS1Buffer[];
double MS2Buffer[];
double MS3Buffer[];
double MS1, MS2, MS3, P, S1, S2, S3;
//----
double prev_high=0;
double prev_low=0;
double prev_close=0;
double cur_day=0;
double prev_day=0;
double day_high=0;
double day_low=0;
//+------------------------------------------------------------------+
//| Custom indicator initialization function                         |
//+------------------------------------------------------------------+
int init()
  {
   IndicatorBuffers(3);
//---- indicators
   SetIndexStyle(0,DRAW_LINE, STYLE_DASH);
   SetIndexBuffer(0,MS1Buffer);
   SetIndexStyle(1,DRAW_LINE, STYLE_DASHDOT);
   SetIndexBuffer(1,MS2Buffer);
   SetIndexStyle(2,DRAW_LINE, STYLE_DOT);
   SetIndexBuffer(2,MS3Buffer);
//----
   SetIndexLabel(0,"MS1");
   SetIndexLabel(1,"MS2");
   SetIndexLabel(2,"MS3");
//----
   //   IndicatorShortName("Mid Pivots");
//----
   return(0);
  }
//+------------------------------------------------------------------+
//| Custor indicator deinitialization function                       |
//+------------------------------------------------------------------+
int deinit()
  {
//---- TODO: add your code here
   ObjectDelete("SupMS3");
   ObjectDelete("SupMS2");
   ObjectDelete("SupMS3");
//----
   return(0);
  }
//+------------------------------------------------------------------+
//| Custom indicator iteration function                              |
//+------------------------------------------------------------------+
int start()
  {
   int    counted_bars=IndicatorCounted();
   int cnt, limit;
//---- exit if period is greater than 4 hr charts
   if(Period() > 240)
     {
      Alert("Error - Chart period is greater than 4 Hr.");
      return(-1); // then exit
     }
   if(counted_bars<0) return(-1);
//---- last counted bar will be recounted
   //   if(counted_bars>0) counted_bars--;
   //   limit=(Bars-counted_bars)-1;
   limit=counted_bars;
//---- Get new daily prices & calculate pivots
   for(cnt=limit;cnt >=0;cnt--)
     {
      if (TimeDayOfWeek(Time[cnt])==0)
        {
         cur_day=prev_day;
        }
      else
        {
         cur_day=TimeDay(Time[cnt]- (GMTshift*3600));
        }
      if (prev_day!=cur_day)
        {
         prev_close=Close[cnt+1];
         prev_high=day_high;
         prev_low=day_low;
         day_high=High[cnt];
         day_low =Low[cnt];
         P =(prev_high+prev_low+prev_close)/3;
         S1=(2*P)-prev_high;
         S2=P-(prev_high-prev_low);
         S3=(2*P)-((2*prev_high)-prev_low);
         MS1=(P+S1)/2;
         MS2=(S1+S2)/2;
         MS3=(S2+S3)/2;
         prev_day=cur_day;
        }
      if (High[cnt]>day_high)
        {
         day_high=High[cnt];
        }
      if (Low[cnt]<day_low)
        {
         day_low=Low[cnt];
        }
      //         day_low=Open[cnt]; day_high=Open[cnt];
      //---  Draw  Pivot lines on chart
      MS1Buffer[cnt]=MS1;
      MS2Buffer[cnt]=MS2;
      MS3Buffer[cnt]=MS3;
     }
   if (cur_day==TimeDay(CurTime()))   DisplayLabels();
//----
   return(0);
  }
//+------------------------------------------------------------------+
//|                                                                  |
//+------------------------------------------------------------------+
void DisplayLabels()
  {
   if(ObjectFind("SupMS1")!=0)
     {
      ObjectCreate("SupMS1", OBJ_TEXT, 0, 0, 0);
      ObjectSetText("SupMS1", "      MS 1",fontsize,"Arial",LColor);
     }
   else
     {
      ObjectMove("SupMS1", 0, Time[60],MS1);
     }
   if(ObjectFind("SupMS2")!=0)
     {
      ObjectCreate("SupMS2", OBJ_TEXT, 0, 0, 0);
      ObjectSetText("SupMS2", "      MS 2",fontsize,"Arial",LColor);
     }
   else
     {
      ObjectMove("SupMS2", 0, Time[60],MS2);
     }
   if(ObjectFind("SupMS3")!=0)
     {
      ObjectCreate("SupMS3", OBJ_TEXT, 0, 0, 0);
      ObjectSetText("SupMS3", "      MS 3",fontsize,"Arial",LColor);
     }
   else
     {
      ObjectMove("SupMS3", 0, Time[60],MS3);
     }
  }
//+------------------------------------------------------------------+
Comments