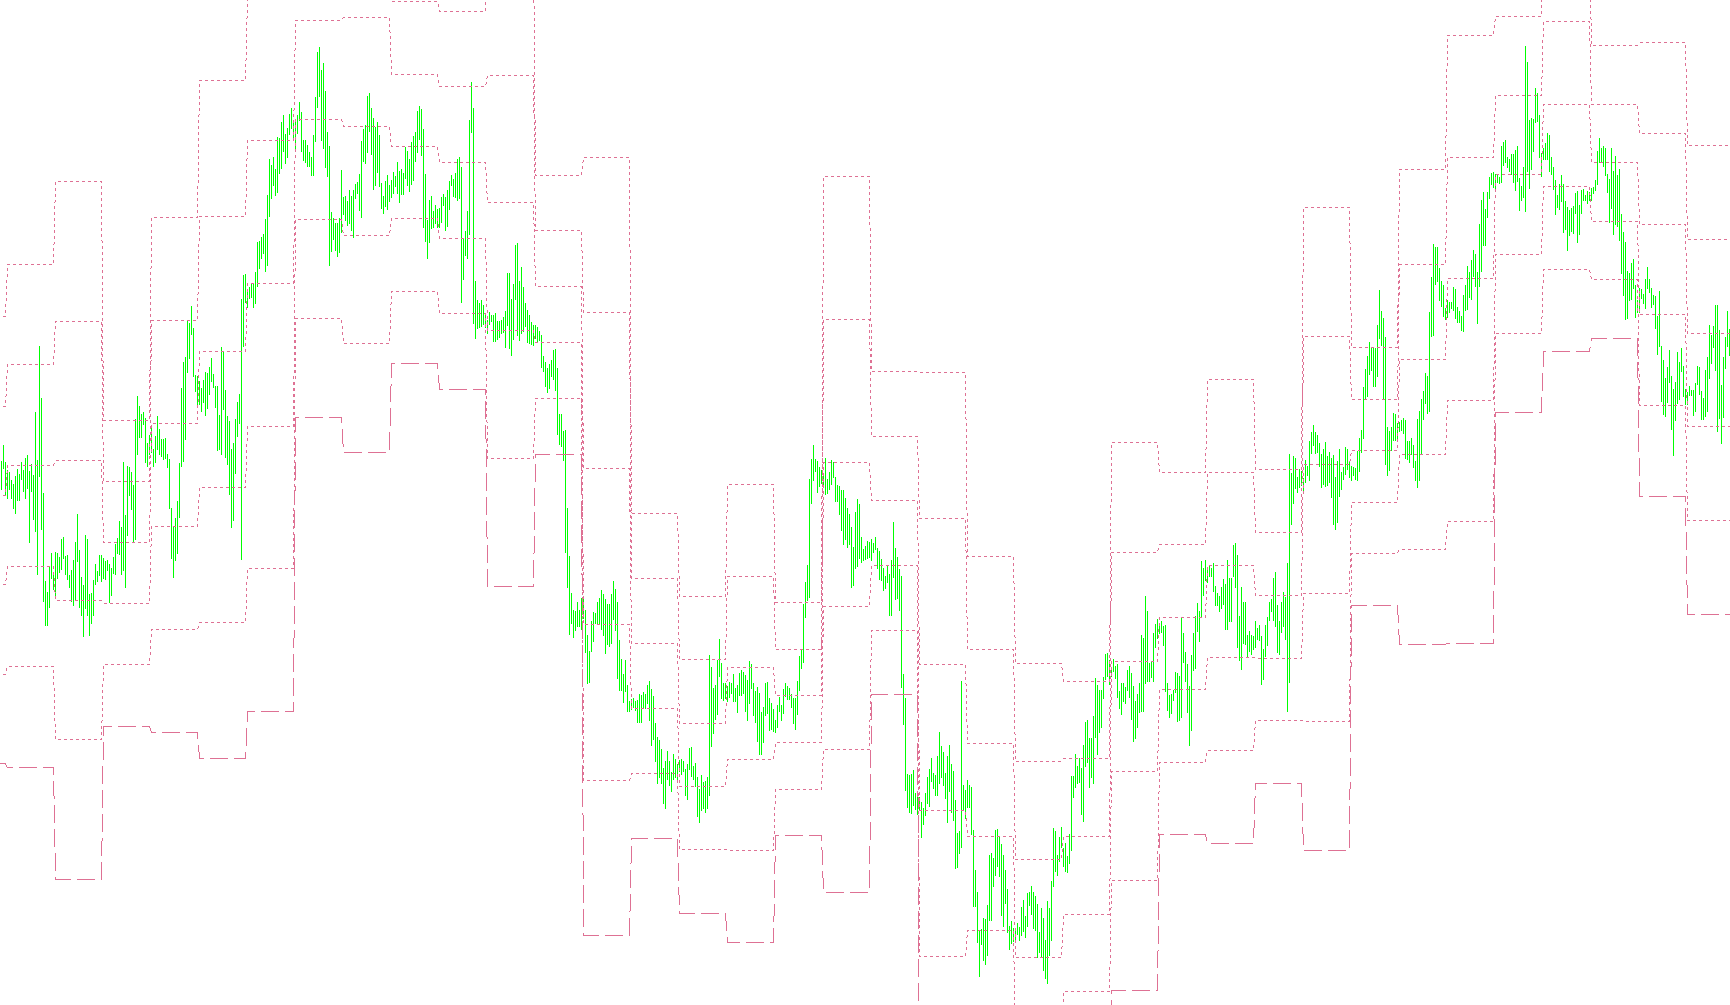
Overview
The Pivot Point Median is a technical analysis tool designed to identify potential support and resistance levels on a trading chart. Rather than just highlighting the primary pivot points, this script calculates a series of "Median" lines—intermediate price levels that exist between the standard high, low, and pivot boundaries. These lines help traders visualize the deeper structure of price action by identifying "halfway" marks that may act as secondary zones of interest.
Core Logic and Mechanics
The indicator operates based on a daily reset logic. It scans historical price data to identify the highest highs and lowest lows of previous trading sessions. When the script detects a change in the day, it triggers a new set of calculations based on the price action of the preceding period.
1. Primary Calculation (The Foundation) First, the script establishes standard Pivot Point values:
- Pivot Point (P): The average of the previous period's High, Low, and Close prices.
- Resistance Levels (R1, R2, R3): Calculated as price targets above the pivot point.
- Support Levels (S1, S2, S3): Calculated as price floors below the pivot point.
2. Median Calculation (The Visual Output) The unique feature of this script is that it takes these standard support and resistance levels and calculates the Medians. It finds the midpoint between various primary points:
- It identifies the halfway marks between Support and Resistance (e.g., the midpoint between R1 and R2).
- It identifies the halfway marks between the Pivot Point and the outer Support/Resistance boundaries (e.g., the midpoint between the Pivot and S1).
- It maps out six distinct Median lines (labeled M0 through M5) that represent these intermediate "equilibrium" zones.
Visual Presentation
The script renders these calculations onto the trading chart in two ways:
- Dynamic Lines: It draws six different types of lines (dashing and dotting styles) to distinguish between the various median levels, allowing for a clear visual map of price "steps."
- On-Chart Labels: The script creates text labels on the chart to identify each specific Median line (M0–M5), ensuring that the user can easily distinguish which zone is which at a glance.
Summary for the User
Essentially, this tool breaks down the large gaps between major support and resistance levels into smaller, more granular "sub-zones." By highlighting these medians, it allows you to see where price might stall or react during a trend, providing a more detailed map of market sentiment than standard pivot points alone.
//+------------------------------------------------------------------+
//|                Pivot Point Median.mq4                            |
//|                Copyright © 2005  Barry Stander                   |
//|                http://www.4Africa.net/4meta/                     |
//|                Pivot Point Median                                |
//|                Version 1.0  26/08/2005                           |
//+------------------------------------------------------------------+

#property copyright "Pivot Point Median                 Barry_Stander_4@yahoo.com"
#property link      "http://www.4Africa.net/4meta/"

#property indicator_chart_window

#property indicator_buffers 7
#property indicator_color1 PaleVioletRed
#property indicator_color2 PaleVioletRed
#property indicator_color3 PaleVioletRed
#property indicator_color4 PaleVioletRed
#property indicator_color5 PaleVioletRed
#property indicator_color6 PaleVioletRed
#property indicator_color7 Black
/*
#property indicator_color1 Black
#property indicator_color2 Red
#property indicator_color3 Blue
#property indicator_color4 Red
#property indicator_color5 Blue
#property indicator_color6 Red
*/
//---- input parameters

//---- buffers
double M0Buffer[];
double M1Buffer[];
double M2Buffer[];
double M3Buffer[];
double M4Buffer[];
double M5Buffer[];


//string Pivot="Pivot Point",Sup1="S 1", Res1="R 1";
//string Sup2="S 2", Res2="R 2", Sup3="S 3", Res3="R 3";

string Med0="M 0",Med1="M 1",Med2="M 2",Med3="M 3",Med4="M 4",Med5="M 5";
int fontsize=10;
double P,S1,R1,S2,R2,S3,R3;
double M0,M1,M2,M3,M4,M5;
double LastHigh,LastLow,x;

//+------------------------------------------------------------------+
//| Custor indicator deinitialization function                       |
//+------------------------------------------------------------------+
int deinit()
  {
//---- TODO: add your code here

   //ObjectDelete("Pivot");
   ObjectDelete("Med0");
   ObjectDelete("Med1");
   ObjectDelete("Med2");
   ObjectDelete("Med3");
   ObjectDelete("Med4");
   ObjectDelete("Med5");

//----
   return(0);
  }
//+------------------------------------------------------------------+
//| Custom indicator initialization function                         |
//+------------------------------------------------------------------+
int init()
  {
   string short_name;


//---- indicator line
   SetIndexStyle(0,DRAW_LINE,STYLE_DASH,1,indicator_color1);
   SetIndexStyle(1,DRAW_LINE,STYLE_DOT,1,indicator_color2);
   SetIndexStyle(2,DRAW_LINE,STYLE_DOT,1,indicator_color3);
   SetIndexStyle(3,DRAW_LINE,STYLE_DOT,1,indicator_color4);
   SetIndexStyle(4,DRAW_LINE,STYLE_DOT,1,indicator_color5);
   SetIndexStyle(5,DRAW_LINE,STYLE_DOT,1,indicator_color6);

   SetIndexBuffer(0,M0Buffer);
   SetIndexBuffer(1,M1Buffer);
   SetIndexBuffer(2,M2Buffer);
   SetIndexBuffer(3,M3Buffer);
   SetIndexBuffer(4,M4Buffer);
   SetIndexBuffer(5,M5Buffer);

//---- name for DataWindow and indicator subwindow label
   short_name="Pivot Point";
   IndicatorShortName(short_name);
   SetIndexLabel(0,short_name);
   SetIndexDrawBegin(0,1);
//----


//----
   return(0);
  }

//+------------------------------------------------------------------+
//| Custom indicator iteration function                              |
//+------------------------------------------------------------------+
int start()

  {
   int    counted_bars=IndicatorCounted();

   int limit, i;
//---- indicator calculation
if (counted_bars==0)
{
   x=Period();
   //if (x>240) return(-1);
   if (x>1440) return(-1);
   ObjectCreate("Med0", OBJ_TEXT, 0, 0,0);
   ObjectSetText("Med0", "      M 0",fontsize,"Arial",indicator_color7);
   ObjectCreate("Med1", OBJ_TEXT, 0, 0, 0);
   ObjectSetText("Med1", "      M 1",fontsize,"Arial",indicator_color7);
   ObjectCreate("Med2", OBJ_TEXT, 0, 0, 0);
   ObjectSetText("Med2", "      M 2",fontsize,"Arial",indicator_color7);
   ObjectCreate("Med3", OBJ_TEXT, 0, 0, 0);
   ObjectSetText("Med3", "      M 3",fontsize,"Arial",indicator_color7);
   ObjectCreate("Med4", OBJ_TEXT, 0, 0, 0);
   ObjectSetText("Med4", "      M 4",fontsize,"Arial",indicator_color7);
   ObjectCreate("Med5", OBJ_TEXT, 0, 0, 0);
   ObjectSetText("Med5", "      M 5",fontsize,"Arial",indicator_color7);

}
   if(counted_bars<0) return(-1);
//---- last counted bar will be recounted
   if(counted_bars>0) counted_bars--;

   limit=(Bars-counted_bars)-1;
   //limit = ( Period() * 3 ) /24;
/*
Comment( limit ," = " , Bars ," - " ,counted_bars );

if(days <=1 )
  days = 2;

if( Period() >= 240 )
limit = ( 1440 /Period() ) * days * 3;
else
limit = ( 1440 /Period() ) * days;
*/
for (i=limit; i>=0;i--)
{

if (High[i+1]>LastHigh) LastHigh=High[i+1];
if (Low[i+1]<LastLow) LastLow=Low[i+1];

if (TimeDay(Time[i])!=TimeDay(Time[i+1]))
   {
/*
 R3   HIGH - (2 x (LOW - PIVOT)
 M5   (R2 + R3) / 2
 R2   (PIVOT-S1) + R1
 M4   (R2 + R1) / 2
 R1   (2 x PIVOT) - LOW
 M3   (PIVOT + R1) / 2
 PIVOT   (HIGH + LOW + CLOSE) / 3
 M2   (PIVOT + S1) / 2
 S1   (2 x PIVOT) - HIGH
 M1   (S2 + S1) / 2
 S2   PIVOT- (R1-S1)
 M0   (S2 + S3) /2
 S3   LOW - (2 x (HIGH - PIVOT)
*/


   P=(LastHigh+LastLow+Close[i+1])/3;
   R1 = (2*P)-LastLow;
   S1 = (2*P)-LastHigh;
   R2 = P+(LastHigh - LastLow);
   S2 = P-(LastHigh - LastLow);
   R3 = (2*P)+(LastHigh-(2*LastLow));
   S3 = (2*P)-((2* LastHigh)-LastLow);

 M5 = (R2 + R3) / 2 ;
 M4 = (R2 + R1) / 2 ;
 M3 = (P + R1) / 2  ;
 M2 = (P + S1) / 2  ;
 M1 = (S2 + S1) / 2 ;
 M0 = (S2 + S3) /2  ;
 /*
 R3   HIGH - (2 x (LOW - PIVOT)
 R2   (PIVOT-S1) + R1
 S2   PIVOT- (R1-S1)
 S3   LOW - (2 x (HIGH - PIVOT)
  */

   LastLow=Open[i]; LastHigh=Open[i];

   ObjectMove("Med0", 0, Time[i],M0);
   ObjectMove("Med1", 0, Time[i],M1);
   ObjectMove("Med2", 0, Time[i],M2);
   ObjectMove("Med3", 0, Time[i],M3);
   ObjectMove("Med4", 0, Time[i],M4);
   ObjectMove("Med5", 0, Time[i],M5);

   }


    M0Buffer[i]=M0;
    M1Buffer[i]=M1;
    M2Buffer[i]=M2;
    M3Buffer[i]=M3;
    M4Buffer[i]=M4;
    M5Buffer[i]=M5;

   SetIndexStyle(0,DRAW_LINE,STYLE_DASH,1,indicator_color1);
   SetIndexStyle(1,DRAW_LINE,STYLE_DOT,1,indicator_color2);
   SetIndexStyle(2,DRAW_LINE,STYLE_DOT,1,indicator_color3);
   SetIndexStyle(3,DRAW_LINE,STYLE_DOT,1,indicator_color4);
   SetIndexStyle(4,DRAW_LINE,STYLE_DOT,1,indicator_color5);
   SetIndexStyle(5,DRAW_LINE,STYLE_DOT,1,indicator_color6);


}


   return(0);
  }
//+------------------------------------------------------------------+
Comments