Pivot SR-mod
Download script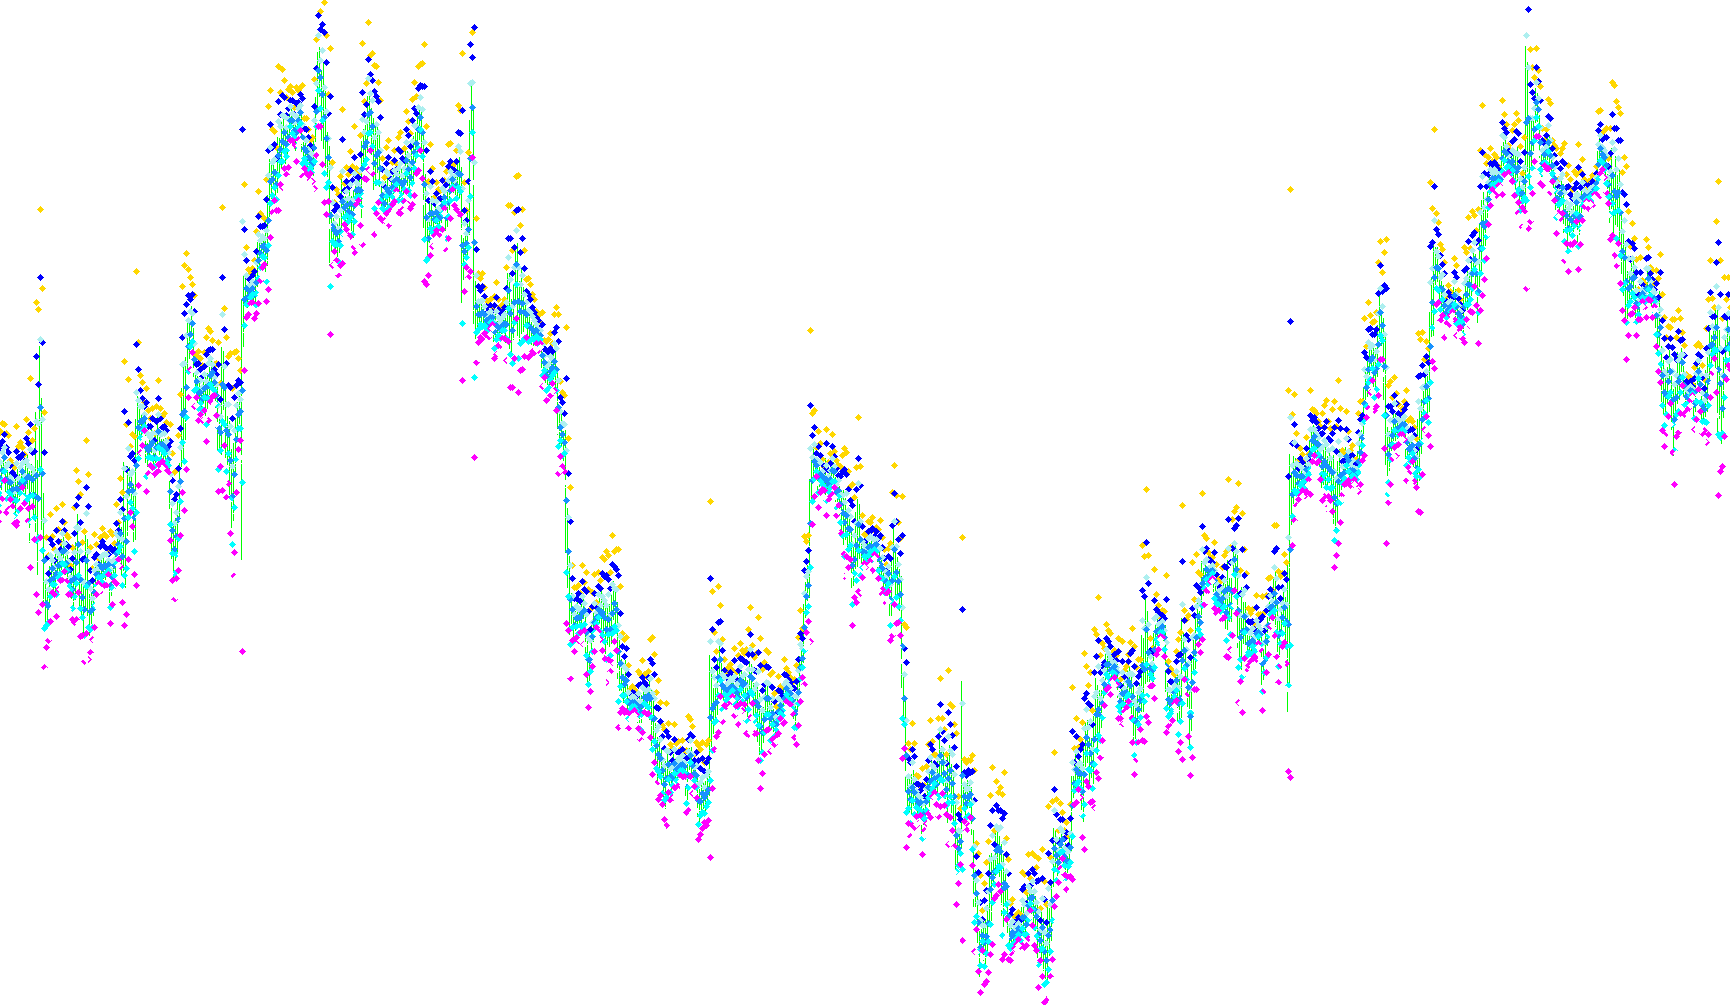
This technical indicator is designed to automatically identify and plot key price levels on your trading chart, specifically focusing on "Pivot Points." In trading, Pivot Points are used by market participants to determine the overall sentiment of the market and to establish potential areas of support and resistance.
How the Logic Works
The script functions by analyzing historical price action to project specific zones where the price might react, stall, or reverse. It focuses on the high, low, and closing prices of the previous candle (or session) to calculate a series of levels for the current period:
1. The Pivot Point (P) This is the central equilibrium point. The script calculates this by taking the average of three specific values from the preceding period: the highest price reached, the lowest price reached, and the closing price. Think of this as the "fair value" or the balance point for the current market session.
2. Support Levels (S1, S2, S3) These represent the "floors" of the market.
- S1 and S2: These are calculated based on the distance between the previous period's high and low relative to the Pivot Point. They indicate where buyers might step in if the price starts to drop.
- S3: This is an extended support level, providing a deeper "safety net" for the price.
3. Resistance Levels (R1, R2, R3) These represent the "ceilings" of the market.
- R1 and R2: Similar to the support levels, these indicate areas where selling pressure is expected to increase as the price rises.
- R3: This is an extended resistance level, marking a significant barrier where the price may struggle to move higher.
Key Features of the Logic
- Dynamic Updates: The script automatically detects when a new timeframe or day begins (based on time changes). When this happens, it refreshes all calculations to ensure the levels are always relevant to the current market context.
- Precision Handling: It includes a normalization feature that ensures the calculated price levels match the specific decimal precision of the currency pair you are trading (e.g., ensuring it doesn't show unnecessary trailing zeros).
- Visual Mapping: The indicator converts these complex mathematical formulas into visible dots on your chart, allowing you to see exactly where these key structural boundaries lie at a glance.
In summary, this tool automates the heavy lifting of calculating market "landmarks." By visualizing these levels, it helps traders identify where the market might encounter friction, allowing for more informed decisions on where to enter or exit trades.
//+------------------------------------------------------------------+
//|                                                        Pivot.mq4 |
//|                               Copyright © 2004, Poul_Trade_Forum |
//|                                                         Aborigen |
//|                                          http://forex.kbpauk.ru/ |
//+------------------------------------------------------------------+
//+------------------------------------------------------------------+
//|                                                 Pivot SR-mod.mq4 |
//|                                                       by Ibrahim |
//|                           http://winning-solution.com/?id=baim78 |
//+------------------------------------------------------------------+
#property copyright "Pivot SR by Aborigen, -mod by Ibrahim"
#property link      "http://forex.kbpauk.ru/"
#property link      "http://winning-solution.com/?id=baim78"

#property indicator_chart_window
#property indicator_buffers 7
#property indicator_color1 Tomato
#property indicator_color2 Tomato
#property indicator_color3 Tomato
#property indicator_color4 Lime
#property indicator_color5 SkyBlue
#property indicator_color6 SkyBlue
#property indicator_color7 SkyBlue
//---- input parameters

extern bool	NormalizeDigits = false;

//---- buffers
double PBuffer[];
double S1Buffer[];
double R1Buffer[];
double S2Buffer[];
double R2Buffer[];
double S3Buffer[];
double R3Buffer[];
int fontsize=10;
double P,R1,S1,R2,S2,R3,S3;
double LastHigh,LastLow,x;

//+------------------------------------------------------------------+
//| Custor indicator deinitialization function                       |
//+------------------------------------------------------------------+
int deinit()
  {
//---- TODO: add your code here

   ObjectDelete("Pivot");
   ObjectDelete("R1");
   ObjectDelete("S1");
   //ObjectDelete("");
   //ObjectDelete("");
   //ObjectDelete("");
   //ObjectDelete("");

//----
   return(0);
  }
//+------------------------------------------------------------------+
//| Custom indicator initialization function                         |
//+------------------------------------------------------------------+
int init()
  {
   string short_name;


//---- indicator line
   SetIndexArrow(0, 119);
   SetIndexArrow(1, 119);
   SetIndexArrow(2, 119);
   SetIndexArrow(3, 119);
   SetIndexArrow(4, 119);
   SetIndexArrow(5, 119);
   SetIndexArrow(6, 119);

   SetIndexStyle(0,DRAW_ARROW,STYLE_DOT);
   SetIndexStyle(1,DRAW_ARROW,STYLE_DOT);
   SetIndexStyle(2,DRAW_ARROW,STYLE_DOT);
   SetIndexStyle(3,DRAW_ARROW,STYLE_DOT);
   SetIndexStyle(4,DRAW_ARROW,STYLE_DOT);
   SetIndexStyle(5,DRAW_ARROW,STYLE_DOT);
   SetIndexStyle(6,DRAW_ARROW,STYLE_DOT);

   SetIndexBuffer(0,R3Buffer);
   SetIndexBuffer(1,R2Buffer);
   SetIndexBuffer(2,R1Buffer);
   SetIndexBuffer(3,PBuffer);
   SetIndexBuffer(4,S1Buffer);
   SetIndexBuffer(5,S2Buffer);
   SetIndexBuffer(6,S3Buffer);


//---- name for DataWindow and indicator subwindow label
	IndicatorShortName("Pivot SR-mod");
	SetIndexLabel(0,"Previous Bar R3");
	SetIndexLabel(1,"Previous Bar R2");
	SetIndexLabel(2,"Previous Bar R1");
	SetIndexLabel(3,"Previous Bar Pivot");
	SetIndexLabel(4,"Previous Bar S1");
	SetIndexLabel(5,"Previous Bar S2");
	SetIndexLabel(6,"Previous Bar S3");

//----
   SetIndexDrawBegin(0,1);
//----


//----
   return(0);
  }

//+------------------------------------------------------------------+
//| Custom indicator iteration function                              |
//+------------------------------------------------------------------+
int start()

  {
   int    counted_bars=IndicatorCounted();

   int limit, i;
//---- indicator calculation
if (counted_bars==0)
{
   x=Period();
   if (x>240) return(-1);
/*
   ObjectCreate("Pivot", OBJ_TEXT, 0, 0,0);
   ObjectSetText("Pivot", "                 Pivot Point",fontsize,"Arial",Red);
   ObjectCreate("Sup1", OBJ_TEXT, 0, 0, 0);
   ObjectSetText("Sup1", "      S 1",fontsize,"Arial",Red);
   ObjectCreate("Res1", OBJ_TEXT, 0, 0, 0);
   ObjectSetText("Res1", "      R 1",fontsize,"Arial",Red);
   ObjectCreate("Sup2", OBJ_TEXT, 0, 0, 0);
   ObjectSetText("Sup2", "      S 2",fontsize,"Arial",Red);
   ObjectCreate("Res2", OBJ_TEXT, 0, 0, 0);
   ObjectSetText("Res2", "      R 2",fontsize,"Arial",Red);
   ObjectCreate("Sup3", OBJ_TEXT, 0, 0, 0);
   ObjectSetText("Sup3", "      S 3",fontsize,"Arial",Red);
   ObjectCreate("Res3", OBJ_TEXT, 0, 0, 0);
   ObjectSetText("Res3", "      R 3",fontsize,"Arial",Red);
*/
}
   if(counted_bars<0) return(-1);
//---- last counted bar will be recounted
//   if(counted_bars>0) counted_bars--;
   limit=(Bars-counted_bars)-1;


for (i=limit; i>=0;i--)
//for (i=1; i<=counted_bars;i++)
{

//if (High[i+1]>LastHigh) LastHigh=High[i+1];
//if (Low[i+1]<LastLow) LastLow=Low[i+1];
LastHigh=High[i+1];
LastLow=Low[i+1];

//if (TimeDay(Time[i])!=TimeDay(Time[i+1]))
if (Time[i]!=Time[i+1])
   {
   P = (LastHigh+LastLow+Close[i+1])/3;
   if (NormalizeDigits) P = NormalizeDouble((LastHigh+LastLow+Close[i+1])/3,Digits);
   R1 = (2*P)-LastLow;
   S1 = (2*P)-LastHigh;
   R2 = P+(LastHigh - LastLow);
   S2 = P-(LastHigh - LastLow);
   R3 = (2*P)+(LastHigh-(2*LastLow));
   S3 = (2*P)-((2* LastHigh)-LastLow);
//   LastLow=Open[i]; LastHigh=Open[i];

/*
   ObjectMove("Pivot", 0, Time[i],P);
   ObjectMove("Sup1", 0, Time[i],S1);
   ObjectMove("Res1", 0, Time[i],R1);
   ObjectMove("Sup2", 0, Time[i],S2);
   ObjectMove("Res2", 0, Time[i],R2);
   ObjectMove("Sup3", 0, Time[i],S3);
   ObjectMove("Res3", 0, Time[i],R3);
*/
   }

/*
    PBuffer[i]=P;
    S1Buffer[i]=S1;
    R1Buffer[i]=R1;
    S2Buffer[i]=S2;
    R2Buffer[i]=R2;
    S3Buffer[i]=S3;
    R3Buffer[i]=R3;
*/
    PBuffer[i]=NormalizeDouble(P,Digits);
    S1Buffer[i]=NormalizeDouble(S1,Digits);
    R1Buffer[i]=NormalizeDouble(R1,Digits);
    S2Buffer[i]=NormalizeDouble(S2,Digits);
    R2Buffer[i]=NormalizeDouble(R2,Digits);
    S3Buffer[i]=NormalizeDouble(S3,Digits);
    R3Buffer[i]=NormalizeDouble(R3,Digits);
}

//----
   return(0);
  }
//+------------------------------------------------------------------+
Comments