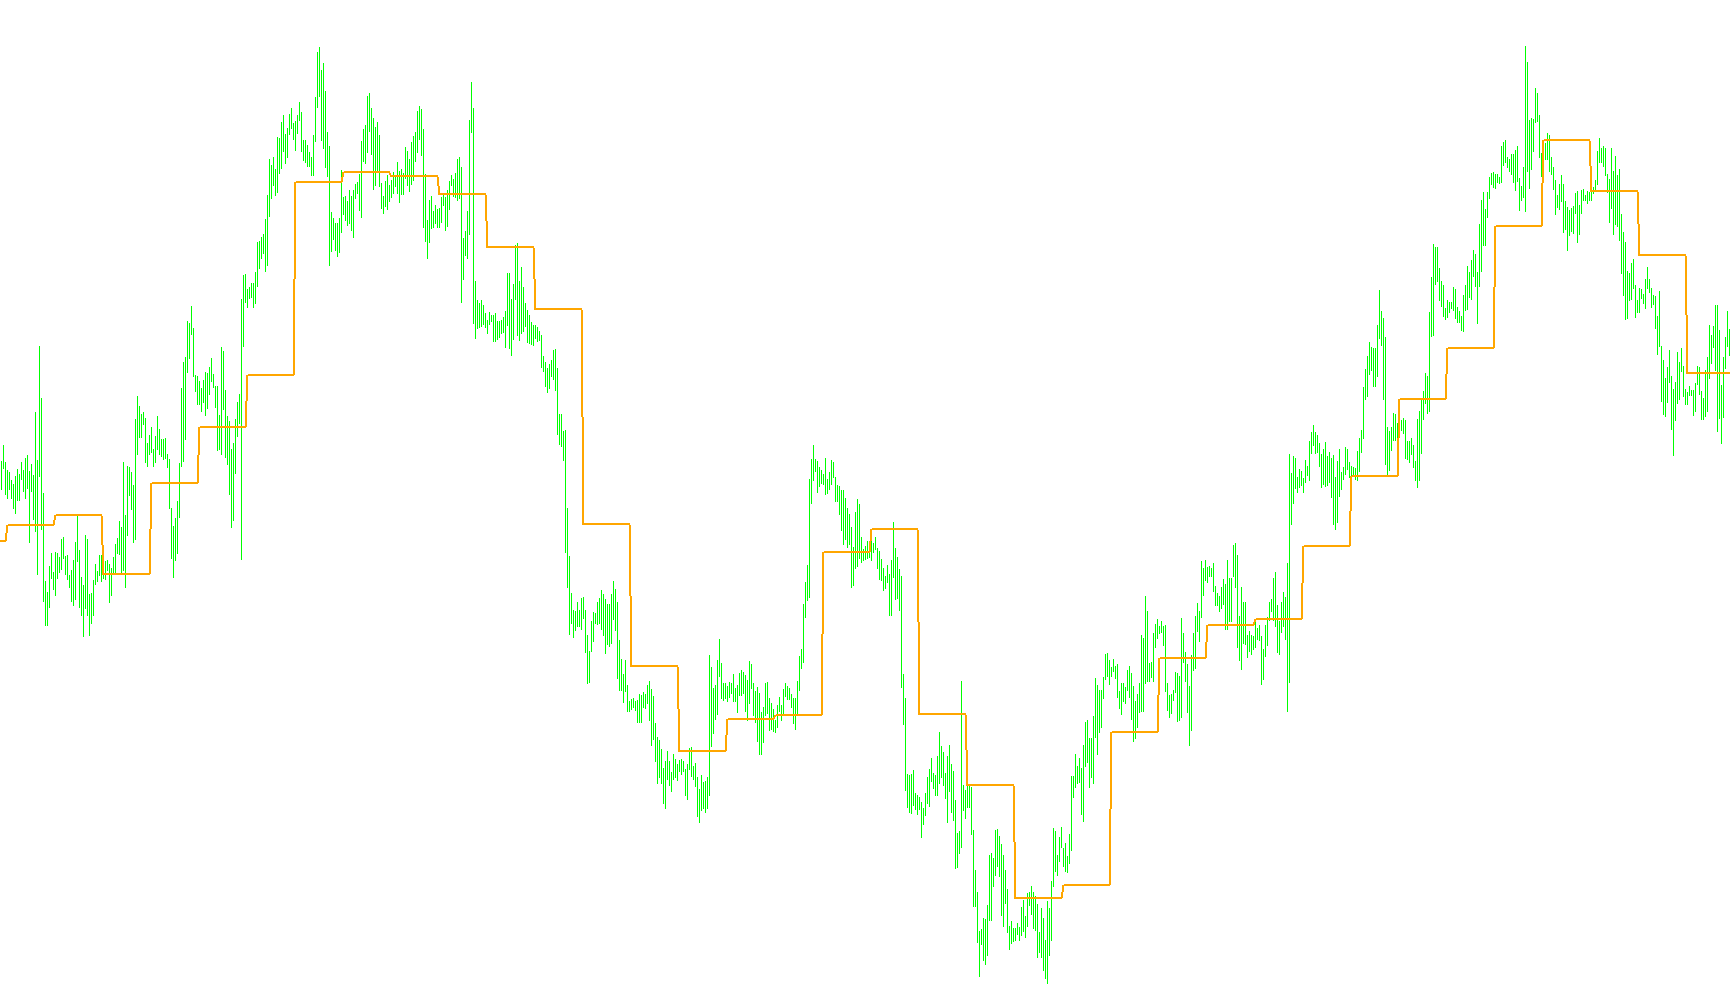
This tool is designed to automatically identify and display Pivot Points directly on your trading chart. Pivot Points are essential technical analysis levels used by traders to determine the overall trend of the market and to identify potential areas for price reversals or continuations.
How the Logic Works
The script functions by analyzing historical price data to calculate a "central" price point for the current trading session. Here is a breakdown of the logic it follows:
1. Tracking Market Extremes The tool constantly monitors the price movement of the previous trading period. Specifically, it identifies the highest price reached (High) and the lowest price reached (Low) during that time frame. It also keeps track of the closing price of that period.
2. Detecting New Trading Days The script is programmed to recognize when a new day begins. By identifying the exact moment the calendar date changes, it knows that the "old" data is finished and it needs to establish a new Pivot Point for the current day.
3. Calculating the Pivot Point Once a new day is detected, the tool performs a specific mathematical calculation:
- It takes the High of the previous day.
- It takes the Low of the previous day.
- It takes the Closing Price of the previous day.
- It averages these three values together to create the Pivot Point.
4. Dynamic Visual Mapping After the calculation is complete, the script automatically places a visual marker on your chart at that specific price level. As new price data arrives, the tool updates this line to ensure you are always seeing the correct pivot level for the current trading period.
Key Features for the User
- Automated Updates: You do not need to manually calculate these figures; the script handles all the math in real-time as the market moves.
- Visual Clarity: By highlighting the Pivot Point on your chart, it provides a clear "balance" line, helping you quickly see if the price is trading above or below the previous day's average sentiment.
- Timeframe Compatibility: The logic is designed to work across different timeframes, though it is optimized for standard daily movements.
/*-----------------------------+
|			       |
| Shared by www.Aptrafx.com    |
|			       |
+------------------------------*/

//+------------------------------------------------------------------+
//|                                                        Pivot.mq4 |
//|                               Copyright © 2004, Poul_Trade_Forum |
//|                                                         Aborigen |
//|                                          http://forex.kbpauk.ru/ |
//+------------------------------------------------------------------+
#property copyright "Poul Trade Forum"
#property link      "http://forex.kbpauk.ru/"

#property indicator_chart_window
//#property indicator_separate_window
#property indicator_buffers 7
#property indicator_color1 Orange
//#property indicator_color2
//#property indicator_color3
//#property indicator_color4
//#property indicator_color5
//#property indicator_color6
//#property indicator_color7
//---- input parameters

//---- buffers
double PBuffer[];
//double S1Buffer[];
//double R1Buffer[];
//double S2Buffer[];
//double R2Buffer[];
//double S3Buffer[];
//double R3Buffer[];
string Pivot="Pivot Point";
//string Sup2="", Res2="", Sup3="", Res3="";
int fontsize=10;
double P;
double LastHigh,LastLow,x;

//+------------------------------------------------------------------+
//| Custor indicator deinitialization function                       |
//+------------------------------------------------------------------+
int deinit()
  {
//---- TODO: add your code here

   ObjectDelete("Pivot");
   //ObjectDelete("");
   //ObjectDelete("");
   //ObjectDelete("");
   //ObjectDelete("");
   //ObjectDelete("");
   //ObjectDelete("");

//----
   return(0);
  }
//+------------------------------------------------------------------+
//| Custom indicator initialization function                         |
//+------------------------------------------------------------------+
int init()
  {
   string short_name;


//---- indicator line
   SetIndexStyle(0,DRAW_LINE,0,2,Orange);
   //SetIndexStyle(1,DRAW_LINE,0,2,);
   //SetIndexStyle(2,DRAW_LINE,0,2,);
   //SetIndexStyle(3,DRAW_LINE,0,2,);
   //SetIndexStyle(4,DRAW_LINE,0,2,);
   //SetIndexStyle(5,DRAW_LINE,0,2,);
   //SetIndexStyle(6,DRAW_LINE,0,2,);
   SetIndexBuffer(0,PBuffer);
   //SetIndexBuffer(1,S1Buffer);
   //SetIndexBuffer(2,R1Buffer);
   //SetIndexBuffer(3,S2Buffer);
   //SetIndexBuffer(4,R2Buffer);
   //SetIndexBuffer(5,S3Buffer);
   //SetIndexBuffer(6,R3Buffer);


//---- name for DataWindow and indicator subwindow label
   short_name="Pivot Point";
   IndicatorShortName(short_name);
   SetIndexLabel(0,short_name);

//----
   SetIndexDrawBegin(0,1);
//----


//----
   return(0);
  }

//+------------------------------------------------------------------+
//| Custom indicator iteration function                              |
//+------------------------------------------------------------------+
int start()

  {
   int    counted_bars=IndicatorCounted();

   int limit, i;
//---- indicator calculation
if (counted_bars==0)
{
   x=Period();
   if (x>240) return(-1);
   //ObjectCreate("Pivot", OBJ_TEXT, 0, 0,0);
   //ObjectSetText("Pivot", "                 Pivot Point",fontsize,"Arial",Red);
   //ObjectCreate("Sup1", OBJ_TEXT, 0, 0, 0);
   //ObjectSetText("Sup1", "      S 1",fontsize,"Arial",Red);
   //ObjectCreate("Res1", OBJ_TEXT, 0, 0, 0);
   //ObjectSetText("Res1", "      R 1",fontsize,"Arial",Red);
   //ObjectCreate("Sup2", OBJ_TEXT, 0, 0, 0);
   //ObjectSetText("Sup2", "      S 2",fontsize,"Arial",Red);
   //ObjectCreate("Res2", OBJ_TEXT, 0, 0, 0);
   //ObjectSetText("Res2", "      R 2",fontsize,"Arial",Red);
   //ObjectCreate("Sup3", OBJ_TEXT, 0, 0, 0);
  // ObjectSetText("Sup3", "      S 3",fontsize,"Arial",Red);
   //ObjectCreate("Res3", OBJ_TEXT, 0, 0, 0);
   //ObjectSetText("Res3", "      R 3",fontsize,"Arial",Red);
}
   if(counted_bars<0) return(-1);
//---- last counted bar will be recounted
//   if(counted_bars>0) counted_bars--;
   limit=(Bars-counted_bars)-1;


for (i=limit; i>=0;i--)
{

if (High[i+1]>LastHigh) LastHigh=High[i+1];
if (Low[i+1]<LastLow) LastLow=Low[i+1];

if (TimeDay(Time[i])!=TimeDay(Time[i+1]))
   {
   P=(LastHigh+LastLow+Close[i+1])/3;
   //R1 = (2*P)-LastLow;
   //S1 = (2*P)-LastHigh;
   //R2 = P+(LastHigh - LastLow);
   //S2 = P-(LastHigh - LastLow);
   //R3 = (2*P)+(LastHigh-(2*LastLow));
   //S3 = (2*P)-((2* LastHigh)-LastLow);
   LastLow=Open[i]; LastHigh=Open[i];

   ObjectMove("Pivot", 0, Time[i],P);
   //ObjectMove("Sup1", 0, Time[i],S1);
   //ObjectMove("Res1", 0, Time[i],R1);
   //ObjectMove("Sup2", 0, Time[i],S2);
   //ObjectMove("Res2", 0, Time[i],R2);
   //ObjectMove("Sup3", 0, Time[i],S3);
   //ObjectMove("Res3", 0, Time[i],R3);

   }

    PBuffer[i]=P;
    //S1Buffer[i]=S1;
    //R1Buffer[i]=R1;
    //S2Buffer[i]=S2;
    //R2Buffer[i]=R2;
    //S3Buffer[i]=S3;
    //R3Buffer[i]=R3;

}

//----
   return(0);
  }
//+------------------------------------------------------------------+
Comments