--PivotCustomTime----_v1
Download script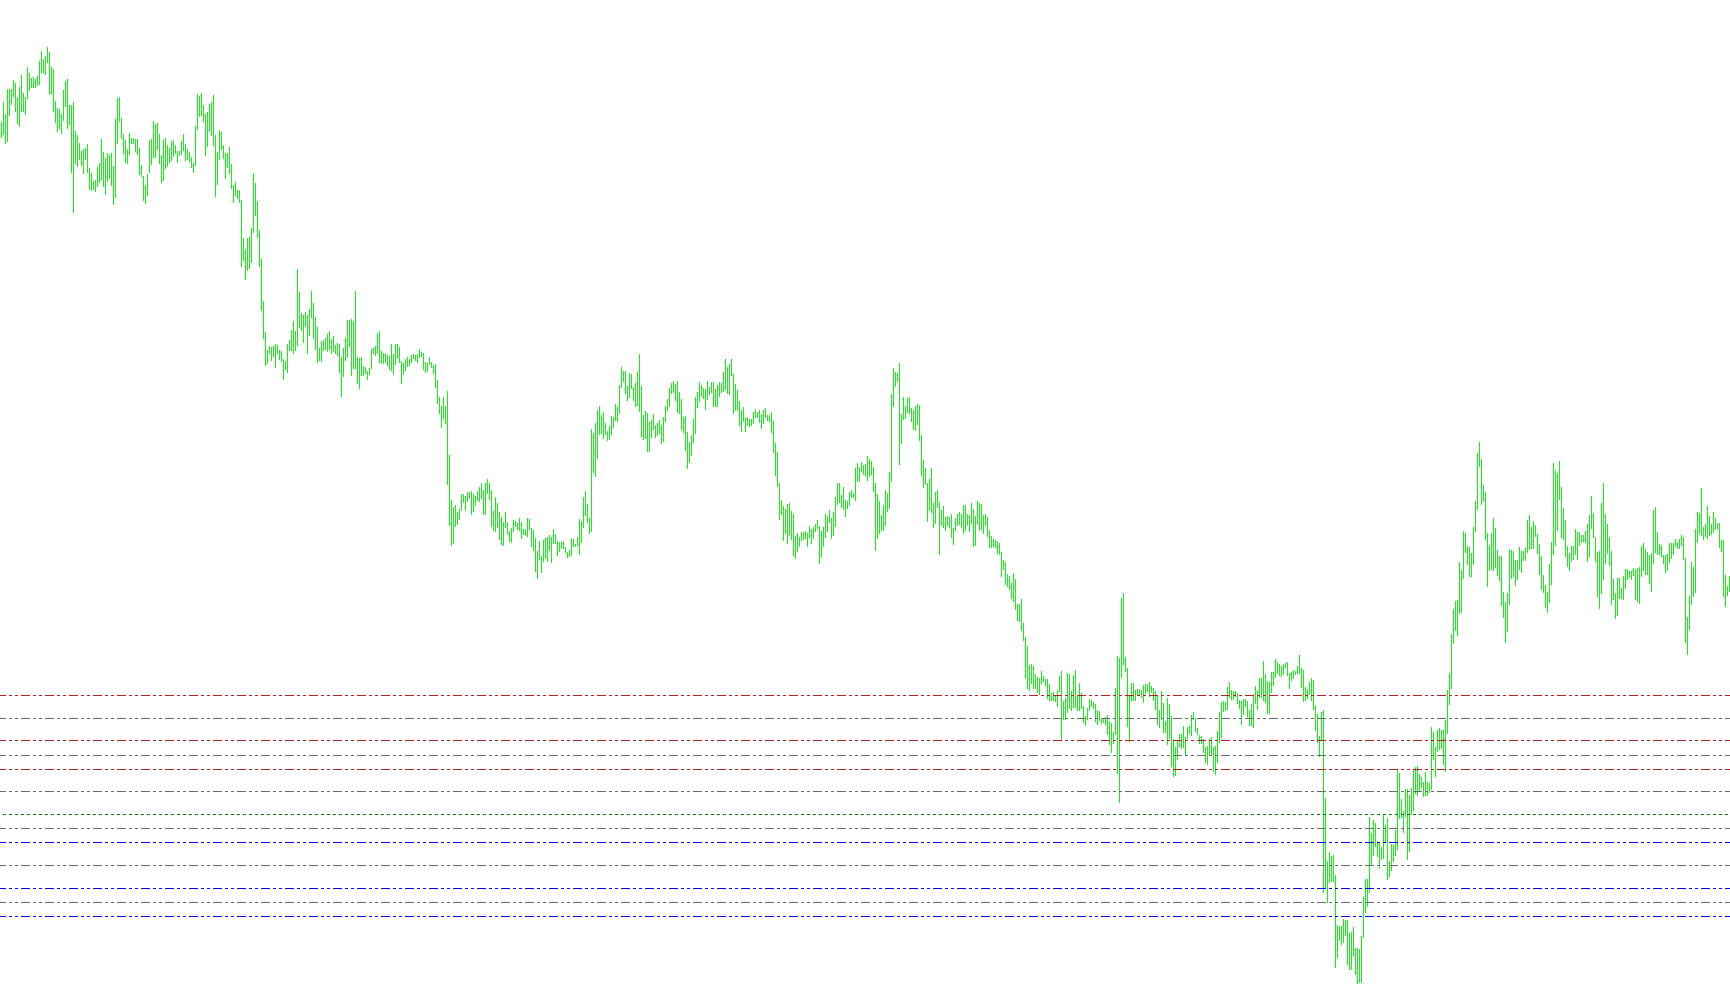
This script is designed for traders using the MetaTrader platform to automatically calculate and display various "Pivot Points" on their price charts. Pivot points are technical analysis tools used to identify potential support and resistance levels based on historical price action.
Core Functionality
The script analyzes price data from a specific timeframe (such as Daily, Weekly, or Hourly) to generate three distinct types of analytical lines:
1. Standard Pivot Points The script calculates the primary "Pivot" level (the equilibrium point), along with various Support (S1, S2, S3) and Resistance (R1, R2, R3) levels. It does this by looking at the previous period's high, low, and closing prices.
- Visual Style: These appear as dashed lines on your chart, with colors such as Green for the main Pivot and FireBrick/Blue for the Support and Resistance levels.
2. Camarilla Levels For traders who prefer the Camarilla rotation system—often used to identify breakouts or reversal points—the script can calculate and display specific H3, H4, L3, and L4 levels.
- Visual Style: These are displayed as DimGray lines.
3. Midpoint Pivots This feature provides a more granular breakdown of the price action by calculating intermediate "midpoints" between the main pivot levels (labeled M0 through M5). This helps traders identify smaller nuances in price movement between major zones.
- Visual Style: These appear as DimGray dashed lines.
How It Works Internally
- Data Collection: The script automatically pulls the high, low, open, and close prices from your chosen timeframe (default is Daily).
- Automatic Drawing: Instead of you having to manually draw lines every day, the script creates these labels and horizontal lines on the chart automatically.
- Real-Time Updates: As new price data arrives, the script moves these lines to their correct positions so they stay updated with the current market activity.
- Information Display: A text comment is provided in the corner of your screen showing the previous day's range and the current day's range, giving you a quick snapshot of market volatility.
User Controls
You can toggle these different calculation styles on or off via the settings menu:
- Pivots: Enables/Disables standard Support and Resistance.
- Camarilla: Enables/Disables Camarilla breakout levels.
- Midpivots: Enables/Disables the detailed midpoint markers.
- MyPeriod: Allows you to choose the timeframe the script should use for its calculations (e.g., switching from Daily pivots to Hourly pivots).
//+-------------------------------------------------------------------+
//|                                               PivotCustomTime.mq4 |
//|                       Copyright © 2004, MetaQuotes Software Corp. |
//|                                         http://www.metaquotes.net |
//|                                     Modified by Alejandro Galindo |
//|                                            You are free to use it |
//|      If you want, and if this work/modification is helpful to you |
//|                      send me a PayPal donation to ag@elcactus.com |
//+-------------------------------------------------------------------+
#property copyright "Copyright © 2004, MetaQuotes Software Corp."
#property link "http://www.metaquotes.net"

#property indicator_chart_window
#property indicator_buffers 1
#property indicator_color1 EMPTY
//----
extern bool pivots = true;
extern bool camarilla = false;
extern bool midpivots = true;
extern int MyPeriod = PERIOD_D1;
/*+----------------------------------------------------+
 MyPeriod = Period in minutes to consideration, could be:
 43200 for MN1
 10080 for W1
 1440  for D1
 240   for H4
 60    for H1
 30    for M30
 15    for M15
 5     for M5
 1     for M1
 +-------------------------------------------------------*/
double day_high = 0;
double day_low = 0;
double yesterday_high = 0;
double yesterday_open = 0;
double yesterday_low = 0;
double yesterday_close = 0;
double today_open = 0;
double today_high = 0;
double today_low = 0;
double P = 0;
double Q = 0;
double R1=0, R2=0, R3=0;
double M0=0, M1=0, M2=0, M3=0, M4=0, M5=0;
double S1=0, S2=0, S3=0;
double H4=0, H3=0, L4=0, L3=0;
double nQ = 0;
double nD = 0;
double D = 0;
double rates_d1[2][6];
//----
double ExtMapBuffer1[];
//+------------------------------------------------------------------+
//| Custom indicator initialization function |
//+------------------------------------------------------------------+
int init()
  {
//---- indicators
   SetIndexStyle(0, DRAW_ARROW);
   SetIndexArrow(0, 159);
   SetIndexBuffer(0, ExtMapBuffer1);
//----
return(0);
}
//+------------------------------------------------------------------+
//| Custor indicator deinitialization function |
//+------------------------------------------------------------------+
int deinit()
  {
   ObjectDelete("R1 Label");
   ObjectDelete("R1 Line");
   ObjectDelete("R2 Label");
   ObjectDelete("R2 Line");
   ObjectDelete("R3 Label");
   ObjectDelete("R3 Line");
   ObjectDelete("S1 Label");
   ObjectDelete("S1 Line");
   ObjectDelete("S2 Label");
   ObjectDelete("S2 Line");
   ObjectDelete("S3 Label");
   ObjectDelete("S3 Line");
   ObjectDelete("P Label");
   ObjectDelete("P Line");
   ObjectDelete("H4 Label");
   ObjectDelete("H4 Line");
   ObjectDelete("H3 Label");
   ObjectDelete("H3 Line");
   ObjectDelete("L3 Label");
   ObjectDelete("L3 Line");
   ObjectDelete("L4 Label");
   ObjectDelete("L4 Line");
   ObjectDelete("M5 Label");
   ObjectDelete("M5 Line");
   ObjectDelete("M4 Label");
   ObjectDelete("M4 Line");
   ObjectDelete("M3 Label");
   ObjectDelete("M3 Line");
   ObjectDelete("M2 Label");
   ObjectDelete("M2 Line");
   ObjectDelete("M1 Label");
   ObjectDelete("M1 Line");
   ObjectDelete("M0 Label");
   ObjectDelete("M0 Line");
//----
   return(0);
  }
//+------------------------------------------------------------------+
//| Custom indicator iteration function |
//+------------------------------------------------------------------+
int start()
  {
//---- exit if period is greater than daily charts
   if(Period() > 1440)
     {
       Print("Error - Chart period is greater than 1 day.");
           return(-1); // then exit
     }
//---- Get new daily prices
   ArrayCopyRates(rates_d1, Symbol(), MyPeriod);
   yesterday_close = rates_d1[1][4];
   yesterday_open = rates_d1[1][1];
   today_open = rates_d1[0][1];
   yesterday_high = rates_d1[1][3];
   yesterday_low = rates_d1[1][2];
   day_high = rates_d1[0][3];
   day_low = rates_d1[0][2];
//---- Calculate Pivots
   D = (day_high - day_low);
   Q = (yesterday_high - yesterday_low);
   P = (yesterday_high + yesterday_low + yesterday_close) / 3;
   R1 = (2*P) - yesterday_low;
   S1 = (2*P) - yesterday_high;
   R2 = P + (yesterday_high - yesterday_low);
   S2 = P - (yesterday_high - yesterday_low);
//----
   H4 = (Q*0.55) + yesterday_close;
   H3 = (Q*0.27) + yesterday_close;
   R3 = (2*P) + (yesterday_high - (2*yesterday_low));
   M5 = (R2+R3) / 2;
   // R2 = P-S1+R1;
   M4 = (R1+R2) / 2;
   // R1 = (2*P)-yesterday_low;
   M3 = (P+R1) / 2;
   // P = (yesterday_high + yesterday_low + yesterday_close)/3;
   M2 = (P+S1) / 2;
   // S1 = (2*P)-yesterday_high;
   M1 = (S1+S2) / 2;
   // S2 = P-R1+S1;
   S3 = (2*P) - ((2* yesterday_high) - yesterday_low);
   L3 = yesterday_close - (Q*0.27);
   L4 = yesterday_close - (Q*0.55);
   M0 = (S2 + S3) / 2;
//----
   if(Q > 5)
     {
       nQ = Q;
     }
   else
     {
       nQ = Q*10000;
     }
//----
   if(D > 5)
     {
       nD = D;
     }
   else
     {
       nD = D*10000;
     }
   Comment("High= ", yesterday_high, " Previous DaysRange= ", nQ, "\nLow= ", yesterday_low,
           " Current DaysRange= ", nD, "\nClose= ", yesterday_close);
   //---- Set line labels on chart window
   //---- Pivot Lines
   if(pivots == true)
     {
       if(ObjectFind("R1 label") != 0)
         {
           ObjectCreate("R1 label", OBJ_TEXT, 0, Time[0], R1);
           ObjectSetText("R1 label", " R1", 8, "Arial", DimGray);
         }
       else
         {
           ObjectMove("R1 label", 0, Time[0], R1);
         }
       //----
       if(ObjectFind("R2 label") != 0)
         {
           ObjectCreate("R2 label", OBJ_TEXT, 0, Time[20], R2);
           ObjectSetText("R2 label", " R2", 8, "Arial", DimGray);
         }
       else
         {
           ObjectMove("R2 label", 0, Time[20], R2);
         }
       //----
       if(ObjectFind("R3 label") != 0)
         {
           ObjectCreate("R3 label", OBJ_TEXT, 0, Time[20], R3);
           ObjectSetText("R3 label", " R3", 8, "Arial", DimGray);
         }
       else
         {
           ObjectMove("R3 label", 0, Time[20], R3);
         }
       //----
       if(ObjectFind("P label") != 0)
         {
           ObjectCreate("P label", OBJ_TEXT, 0, Time[0], P);
           ObjectSetText("P label", "Pivot " +DoubleToStr(P,4), 8, "Arial", DimGray);
         }
       else
         {
           ObjectMove("P label", 0, Time[0], P);
         }
       //----
       if(ObjectFind("S1 label") != 0)
         {
           ObjectCreate("S1 label", OBJ_TEXT, 0, Time[0], S1);
           ObjectSetText("S1 label", "S1", 8, "Arial", DimGray);
         }
       else
         {
           ObjectMove("S1 label", 0, Time[0], S1);
         }
       //----
       if(ObjectFind("S2 label") != 0)
         {
           ObjectCreate("S2 label", OBJ_TEXT, 0, Time[20], S2);
           ObjectSetText("S2 label", "S2", 8, "Arial", DimGray);
         }
       else
         {
           ObjectMove("S2 label", 0, Time[20], S2);
         }
       //----
       if(ObjectFind("S3 label") != 0)
         {
           ObjectCreate("S3 label", OBJ_TEXT, 0, Time[20], S3);
           ObjectSetText("S3 label", "S3", 8, "Arial", DimGray);
         }
       else
         {
           ObjectMove("S3 label", 0, Time[20], S3);
         }
       //--- Draw Pivot lines on chart
       if(ObjectFind("S1 line") != 0)
         {
           ObjectCreate("S1 line", OBJ_HLINE, 0, Time[40], S1);
           ObjectSet("S1 line", OBJPROP_STYLE, STYLE_DASHDOTDOT);
           ObjectSet("S1 line", OBJPROP_COLOR, Blue);
         }
       else
         {
           ObjectMove("S1 line", 0, Time[40], S1);
         }
       //----
       if(ObjectFind("S2 line") != 0)
         {
           ObjectCreate("S2 line", OBJ_HLINE, 0, Time[40], S2);
           ObjectSet("S2 line", OBJPROP_STYLE, STYLE_DASHDOTDOT);
           ObjectSet("S2 line", OBJPROP_COLOR, Blue);
         }
       else
         {
           ObjectMove("S2 line", 0, Time[40], S2);
         }
       //----
       if(ObjectFind("S3 line") != 0)
         {
           ObjectCreate("S3 line", OBJ_HLINE, 0, Time[40], S3);
           ObjectSet("S3 line", OBJPROP_STYLE, STYLE_DASHDOTDOT);
           ObjectSet("S3 line", OBJPROP_COLOR, Blue);
         }
       else
         {
           ObjectMove("S3 line", 0, Time[40], S3);
         }
       //----
       if(ObjectFind("P line") != 0)
         {
           ObjectCreate("P line", OBJ_HLINE, 0, Time[40], P);
           ObjectSet("P line", OBJPROP_STYLE, STYLE_DOT);
           ObjectSet("P line", OBJPROP_COLOR, Green);
         }
       else
         {
           ObjectMove("P line", 0, Time[40], P);
         }
       if(ObjectFind("R1 line") != 0)
         {
           ObjectCreate("R1 line", OBJ_HLINE, 0, Time[40], R1);
           ObjectSet("R1 line", OBJPROP_STYLE, STYLE_DASHDOTDOT);
           ObjectSet("R1 line", OBJPROP_COLOR, FireBrick);
         }
       else
         {
           ObjectMove("R1 line", 0, Time[40], R1);
         }
       //----
       if(ObjectFind("R2 line") != 0)
         {
         ObjectCreate("R2 line", OBJ_HLINE, 0, Time[40], R2);
         ObjectSet("R2 line", OBJPROP_STYLE, STYLE_DASHDOTDOT);
         ObjectSet("R2 line", OBJPROP_COLOR, FireBrick);
         }
       else
         {
           ObjectMove("R2 line", 0, Time[40], R2);
         }
       //----
       if(ObjectFind("R3 line") != 0)
         {
           ObjectCreate("R3 line", OBJ_HLINE, 0, Time[40], R3);
           ObjectSet("R3 line", OBJPROP_STYLE, STYLE_DASHDOTDOT);
           ObjectSet("R3 line", OBJPROP_COLOR, FireBrick);
         }
       else
         {
           ObjectMove("R3 line", 0, Time[40], R3);
         }
     }
   //---- End of Pivot Line Draw
   //----- Camarilla Lines
   if(camarilla == true)
     {
       if(ObjectFind("H4 label") != 0)
         {
           ObjectCreate("H4 label", OBJ_TEXT, 0, Time[20], H4);
           ObjectSetText("H4 label", " H4", 8, "Arial", DimGray);
         }
       else
         {
           ObjectMove("H4 label", 0, Time[20], H4);
         }
       //----
       if(ObjectFind("H3 label") != 0)
         {
           ObjectCreate("H3 label", OBJ_TEXT, 0, Time[20], H3);
           ObjectSetText("H3 label", " H3", 8, "Arial", DimGray);
         }
       else
         {
           ObjectMove("H3 label", 0, Time[20], H3);
         }
       //----
       if(ObjectFind("L3 label") != 0)
         {
           ObjectCreate("L3 label", OBJ_TEXT, 0, Time[20], L3);
           ObjectSetText("L3 label", " L3", 8, "Arial", DimGray);
         }
       else
         {
           ObjectMove("L3 label", 0, Time[20], L3);
         }
       //----
       if(ObjectFind("L4 label") != 0)
         {
           ObjectCreate("L4 label", OBJ_TEXT, 0, Time[20], L4);
           ObjectSetText("L4 label", " L4", 8, "Arial", DimGray);
         }
       else
         {
           ObjectMove("L4 label", 0, Time[20], L4);
         }
       //---- Draw Camarilla lines on Chart
       if(ObjectFind("H4 line") != 0)
         {
           ObjectCreate("H4 line", OBJ_HLINE, 0, Time[40], H4);
           ObjectSet("H4 line", OBJPROP_STYLE, STYLE_DASHDOTDOT);
           ObjectSet("H4 line", OBJPROP_COLOR, DimGray);
         }
       else
         {
           ObjectMove("H4 line", 0, Time[40], H4);
         }
       //----
       if(ObjectFind("H3 line") != 0)
         {
           ObjectCreate("H3 line", OBJ_HLINE, 0, Time[40], H3);
           ObjectSet("H3 line", OBJPROP_STYLE, STYLE_DASHDOTDOT);
           ObjectSet("H3 line", OBJPROP_COLOR, DimGray);
         }
       else
         {
           ObjectMove("H3 line", 0, Time[40], H3);
         }
       //----
       if(ObjectFind("L3 line") != 0)
         {
           ObjectCreate("L3 line", OBJ_HLINE, 0, Time[40], L3);
           ObjectSet("L3 line", OBJPROP_STYLE, STYLE_DASHDOTDOT);
           ObjectSet("L3 line", OBJPROP_COLOR, DimGray);
         }
       else
         {
           ObjectMove("L3 line", 0, Time[40], L3);
         }
       //----
       if(ObjectFind("L4 line") != 0)
         {
           ObjectCreate("L4 line", OBJ_HLINE, 0, Time[40], L4);
           ObjectSet("L4 line", OBJPROP_STYLE, STYLE_DASHDOTDOT);
           ObjectSet("L4 line", OBJPROP_COLOR, DimGray);
         }
       else
         {
           ObjectMove("L4 line", 0, Time[40], L4);
         }
     }
   //-------End of Draw Camarilla Lines
   //------ Midpoints Pivots
   if(midpivots == true)
     {
       if(ObjectFind("M5 label") != 0)
         {
           ObjectCreate("M5 label", OBJ_TEXT, 0, Time[20], M5);
           ObjectSetText("M5 label", " M5", 8, "Arial", DimGray);
         }
       else
         {
           ObjectMove("M5 label", 0, Time[20], M5);
         }
       //----
       if(ObjectFind("M4 label") != 0)
         {
           ObjectCreate("M4 label", OBJ_TEXT, 0, Time[20], M4);
           ObjectSetText("M4 label", " M4", 8, "Arial", DimGray);
         }
       else
         {
           ObjectMove("M4 label", 0, Time[20], M4);
         }
       //----
       if(ObjectFind("M3 label") != 0)
         {
           ObjectCreate("M3 label", OBJ_TEXT, 0, Time[20], M3);
           ObjectSetText("M3 label", " M3", 8, "Arial", DimGray);
         }
       else
         {
           ObjectMove("M3 label", 0, Time[20], M3);
         }
       //----
       if(ObjectFind("M2 label") != 0)
         {
           ObjectCreate("M2 label", OBJ_TEXT, 0, Time[20], M2);
           ObjectSetText("M2 label", " M2", 8, "Arial", DimGray);
         }
       else
         {
           ObjectMove("M2 label", 0, Time[20], M2);
         }
       //----
       if(ObjectFind("M1 label") != 0)
         {
           ObjectCreate("M1 label", OBJ_TEXT, 0, Time[20], M1);
           ObjectSetText("M1 label", " M1", 8, "Arial", DimGray);
         }
       else
         {
           ObjectMove("M1 label", 0, Time[20], M1);
         }
       //----
       if(ObjectFind("M0 label") != 0)
         {
           ObjectCreate("M0 label", OBJ_TEXT, 0, Time[20], M0);
           ObjectSetText("M0 label", " M0", 8, "Arial", DimGray);
         }
       else
         {
           ObjectMove("M0 label", 0, Time[20], M0);
         }
       //---- Draw Midpoint Pivots on Chart
       if(ObjectFind("M5 line") != 0)
         {
           ObjectCreate("M5 line", OBJ_HLINE, 0, Time[40], M5);
           ObjectSet("M5 line", OBJPROP_STYLE, STYLE_DASHDOTDOT);
           ObjectSet("M5 line", OBJPROP_COLOR, DimGray);
         }
       else
         {
           ObjectMove("M5 line", 0, Time[40], M5);
         }
       //----
       if(ObjectFind("M4 line") != 0)
         {
           ObjectCreate("M4 line", OBJ_HLINE, 0, Time[40], M4);
           ObjectSet("M4 line", OBJPROP_STYLE, STYLE_DASHDOTDOT);
           ObjectSet("M4 line", OBJPROP_COLOR, DimGray);
         }
       else
         {
           ObjectMove("M4 line", 0, Time[40], M4);
         }
       //----
       if(ObjectFind("M3 line") != 0)
         {
           ObjectCreate("M3 line", OBJ_HLINE, 0, Time[40], M3);
           ObjectSet("M3 line", OBJPROP_STYLE, STYLE_DASHDOTDOT);
           ObjectSet("M3 line", OBJPROP_COLOR, DimGray);
         }
       else
         {
           ObjectMove("M3 line", 0, Time[40], M3);
         }
       //----
       if(ObjectFind("M2 line") != 0)
         {
           ObjectCreate("M2 line", OBJ_HLINE, 0, Time[40], M2);
           ObjectSet("M2 line", OBJPROP_STYLE, STYLE_DASHDOTDOT);
           ObjectSet("M2 line", OBJPROP_COLOR, DimGray);
         }
       else
         {
           ObjectMove("M2 line", 0, Time[40], M2);
         }
       //----
       if(ObjectFind("M1 line") != 0)
         {
           ObjectCreate("M1 line", OBJ_HLINE, 0, Time[40], M1);
           ObjectSet("M1 line", OBJPROP_STYLE, STYLE_DASHDOTDOT);
           ObjectSet("M1 line", OBJPROP_COLOR, DimGray);
         }
       else
         {
           ObjectMove("M1 line", 0, Time[40], M1);
         }
       //----
       if(ObjectFind("M0 line") != 0)
         {
           ObjectCreate("M0 line", OBJ_HLINE, 0, Time[40], M0);
           ObjectSet("M0 line", OBJPROP_STYLE, STYLE_DASHDOTDOT);
           ObjectSet("M0 line", OBJPROP_COLOR, DimGray);
         }
       else
         {
           ObjectMove("M0 line", 0, Time[40], M0);
         }
     }
//----End of Midpoint Pivots Draw
//---- End Of Program
   return(0);
  }
//+------------------------------------------------------------------+
Comments