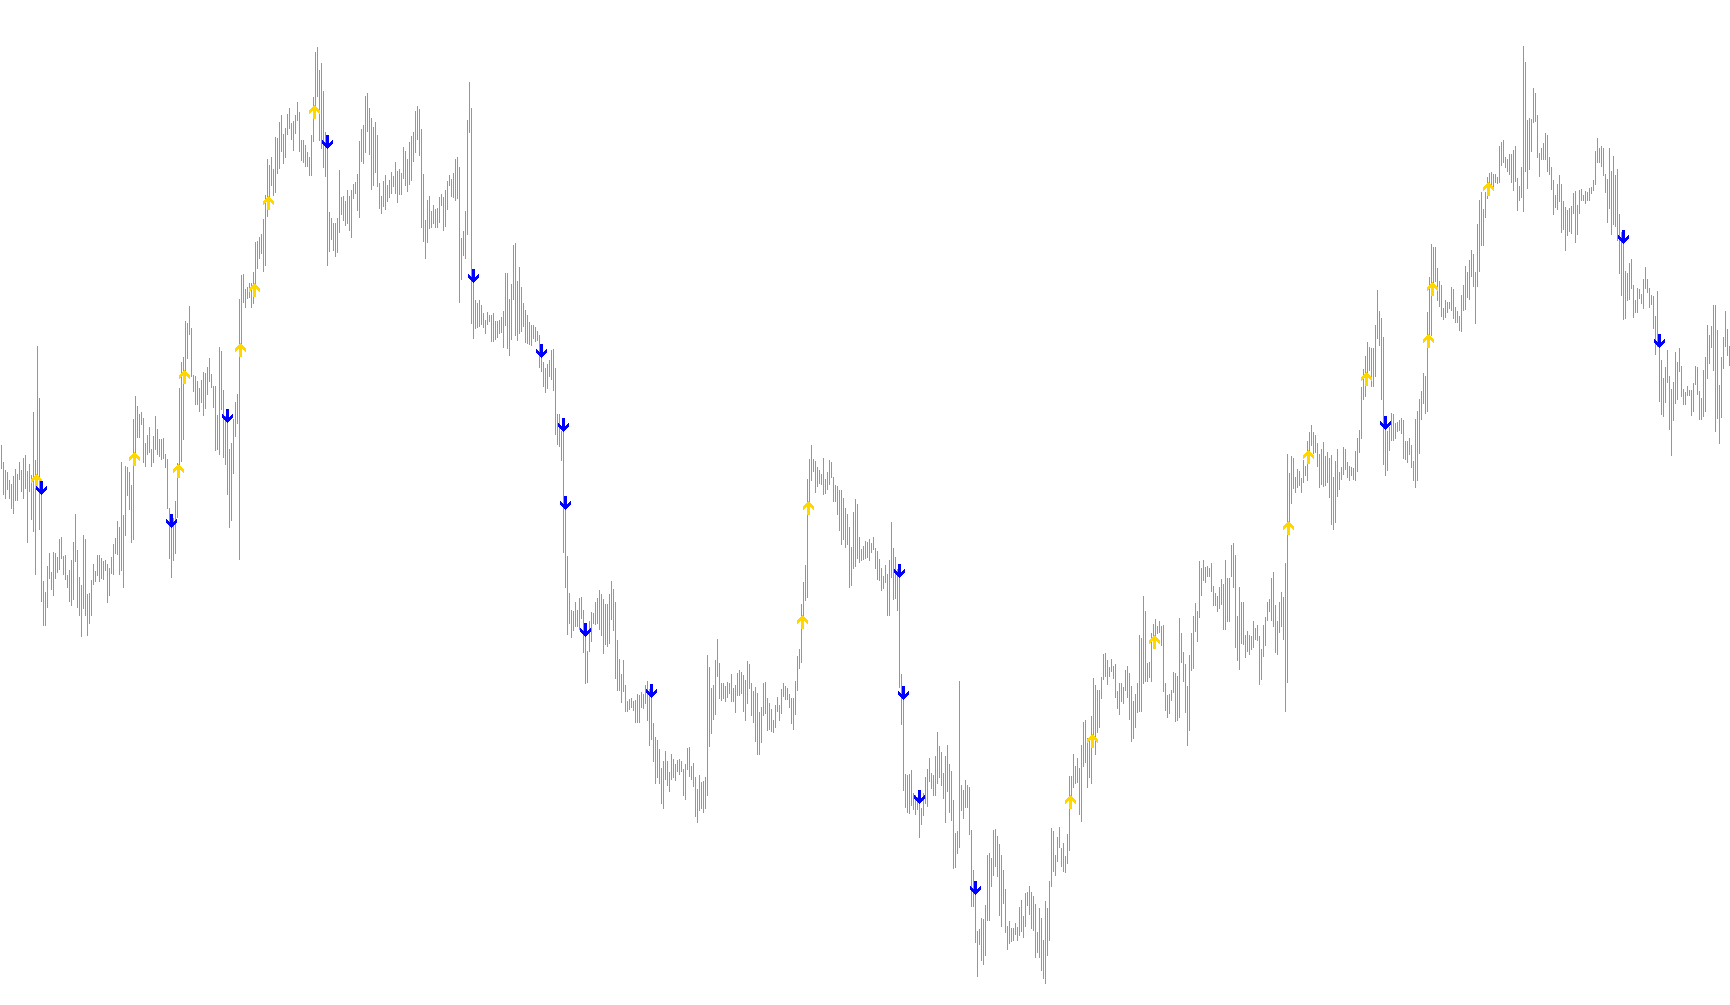
This tool is designed to help traders visualize significant price movements by identifying specific "breakout" points on a trading chart. Instead of showing every small fluctuation in the market, it focuses on capturing moments where the price moves by a predetermined percentage relative to its previous significant level.
How the Logic Works
The script operates by calculating a specific average price for every candle on your chart. Rather than looking just at the closing price, it takes into account the opening, closing, high, and low values of each bar to create a balanced "center point" for that specific period of time.
The core functionality follows a "stepping" logic:
- Reference Point Tracking: The script establishes a base value starting from the beginning of the data. It then monitors the price movement as it moves forward in time.
- Percentage-Based Thresholds: You can set a specific percentage (via the "Percent" setting) that determines how much the price must move to trigger an alert. This acts as a filter, ensuring that only substantial trends are highlighted while minor "noise" is ignored.
- Buy and Sell Signals:
- Upward Movement: If the current average price rises above the previous reference point by more than your chosen percentage, the script places a green arrow on the chart and creates a new, higher reference point.
- Downward Movement: If the average price drops below the previous reference point by more than your chosen percentage, the script places a red arrow and sets a new, lower reference point.
Key Benefits for the User
- Trend Visualization: It simplifies complex charts into a series of clear directional steps, making it easier to see the overall "path" the market is taking.
- Customizable Sensitivity: By adjusting the percentage parameter, you can choose how aggressive or conservative you want the indicator to be. A smaller percentage will result in more frequent signals (higher sensitivity), while a larger percentage will only capture major structural shifts in the market.
- Dynamic Updates: The script constantly recalculates these levels as new data arrives, ensuring that the visual "steps" on your chart remain relevant to current market conditions.
Price Data Components
Miscellaneous
11
Views
0
Downloads
0
Favorites
precentualzz_victor
//+------------------------------------------------------------------+
//|                                               ZigZag Pointer.mq4 |
//|                                    zigzag modified by Dr. Gaines |
//|                                      neamtu_victor@yahoo.com     |
//|                                         neamtu victor            |
//+------------------------------------------------------------------+
#property copyright "neamtu victor"
#property link      "neamtu_victor@yahoo.com"

#property indicator_chart_window
#property indicator_buffers 2
#property indicator_color1 Lime
#property indicator_width1 1
#property indicator_color2 Red
#property indicator_width2 1
//---- indicator parameters
extern double Percent=0.2;
//---- indicator buffers
double buyArrowsBuffer[];
double sellArrowsBuffer[];


//+------------------------------------------------------------------+
//| Custom indicator initialization function                         |
//+------------------------------------------------------------------+


int init()
  {
   IndicatorBuffers(2);
//---- drawing settings
   SetIndexStyle(0,DRAW_ARROW);
   SetIndexArrow(0, 233);//233
   SetIndexStyle(1,DRAW_ARROW);
   SetIndexArrow(1, 234);//234

//---- indicator buffers mapping
   SetIndexBuffer(0,buyArrowsBuffer);
   SetIndexBuffer(1,sellArrowsBuffer);
   SetIndexEmptyValue(0,0.0);

   IndicatorShortName("Percentual ZigZag("+Percent+")");

   Percent /= 100;

   return(0);
  }
//+------------------------------------------------------------------+
//|                                                                  |
//+------------------------------------------------------------------+
double barPrice(int shift){
   double auxPrice=0;

   auxPrice=(iOpen(Symbol(),Period(),shift)+iClose(Symbol(),Period(),shift)+iLow(Symbol(),Period(),shift)+iHigh(Symbol(),Period(),shift))/4;

   return(auxPrice);
}


int start(){

   int shift;
   static double value;
/*
   int counted_bars=IndicatorCounted();
   if(counted_bars<0)
      return(-1);

   int limit=Bars-counted_bars-1;
*/

   for(shift=Bars-1; shift>=0; shift--){

      if (shift == Bars-1){
         value=barPrice(Bars-1);
     }
      else{
         //Print(" barPrice: ", barPrice(shift), " value+p.. ", value );
         if (barPrice(shift) > value + Percent*value){
            buyArrowsBuffer[shift]=iLow(Symbol(),Period(),shift)-10*Point;
            sellArrowsBuffer[shift]=0;
            value=value + Percent*value;
            //Print("Bars ",Bars, " Shift ",shift," barPrice: ", value);
         }


         if (barPrice(shift) < value - Percent*value){
            sellArrowsBuffer[shift]=iHigh(Symbol(),Period(),shift)+10*Point;
            buyArrowsBuffer[shift]=0;
            value=value - Percent*value;
            //Print("Bars ",Bars, " Shift ",shift," barPrice: ", value);
         }
  //
     }


   }


}

  //end//
Comments