price_prevCl-O_Difference2_cw
Download script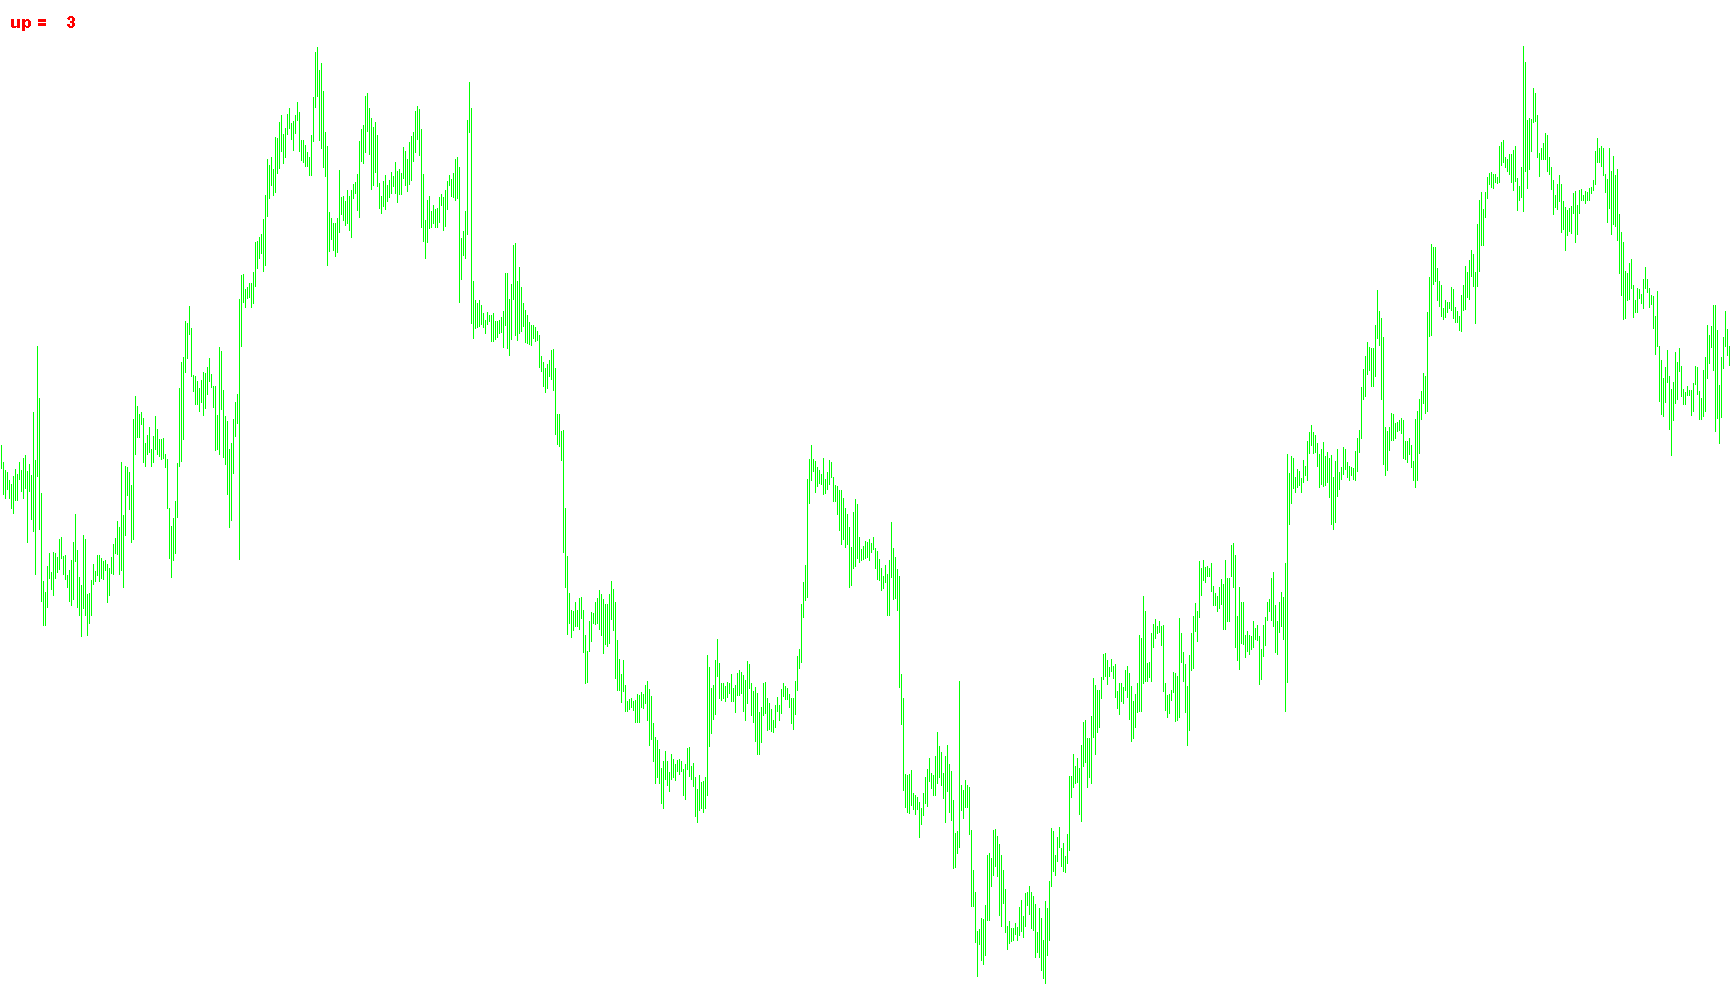
This tool is designed to provide a real-time visual summary of price movement dynamics directly on your trading chart. Instead of requiring you to manually interpret complex candle shapes, it automatically calculates the immediate price transition between two specific points and displays that information as a clear, color-coded text overlay.
How the Logic Works
The script focuses on the relationship between the current live candle's opening price and the previous candle's closing price. By comparing these two values, the tool determines the "gap" or the net change in price that has occurred as the market transitioned from the completed period into the current one.
Visual Indicators and Color Coding
To make this information easy to read at a glance, the script translates the numerical difference into three distinct visual states:
- Upward Movement (Red): If the current opening price is higher than the previous close, the tool identifies an upward shift. It displays an "up" label in red text to alert you to positive momentum.
- Downward Movement (Lime/Green): If the current opening price is lower than the previous close, the tool identifies a downward shift and updates the display to lime green, signaling a drop in price.
- Neutral/Flat Movement (Blue): If there is no difference between the two prices, the tool marks the movement as "flat" and displays the information in blue, indicating stability or no change in the transition.
Key Features for the Trader
- Instant Readability: The script places the result directly on your chart window, so you don't have to look away from the price action to see the data.
- Automated Calculation: It converts the raw decimal price changes into whole numbers, removing "market noise" and providing a clean, readable figure of the price difference.
- Dynamic Updates: The display refreshes automatically with every tick of the market, ensuring that you are always seeing the most current relationship between the previous candle's end and the current candle's start.
//+------------------------------------------------------------------+
//|                                                      Raznost2.mq4 |
//|                                                       TokmanYuriy |
//|  13 ñåíòÿáðÿ 2008 ãîäà                      yuriytokman@gmail.com |
//+------------------------------------------------------------------+
#property copyright "Yuriy Tokman"
#property link      "yuriytokman@gmail.com"

#property indicator_chart_window
//+------------------------------------------------------------------+
//| Custom indicator initialization function                         |
//+------------------------------------------------------------------+
int init()
  {
   ObjectCreate("signal",OBJ_LABEL,0,0,0,0,0);
   ObjectCreate("signal2",OBJ_LABEL,0,0,0,0,0);
   return(0);
  }
//+------------------------------------------------------------------+
//| Custom indicator deinitialization function                       |
//+------------------------------------------------------------------+
int deinit()
  {
//----
   ObjectDelete ("signal");
   ObjectDelete ("signal2");
//----
   return(0);
  }
//+------------------------------------------------------------------+
//| Custom indicator iteration function                              |
//+------------------------------------------------------------------+
int start()
  {
    string name ;
    double a = ((iOpen(NULL,0,0))-(iClose(NULL,0,1)))/Point;
    string par = DoubleToStr(a,0);

    if     (a>0)
    {
     name = "  up = ";
     ObjectSetText("signal",name,12,"Arial Black",Red);
     ObjectSetText("signal2",par,12,"Arial Black",Red);
    }
    else if(a<0)
    {
     name = "down = ";
     ObjectSetText("signal",name,12,"Arial Black",Lime);
     ObjectSetText("signal2",par,12,"Arial Black",Lime);
    }
    else if(a==0)
    {
     name = "flet = ";
     ObjectSetText("signal",name,12,"Arial Black",Blue);
     ObjectSetText("signal2",par,12,"Arial Black",Blue);
    }

   ObjectSet("signal",OBJPROP_XDISTANCE,3);
   ObjectSet("signal2",OBJPROP_XDISTANCE,69);

   ObjectSet("signal",OBJPROP_YDISTANCE,12);
   ObjectSet("signal2",OBJPROP_YDISTANCE,12);

//----
   return(0);
  }
//+------------------------------------------------------------------+
Comments