pricehistogram_channel
Download script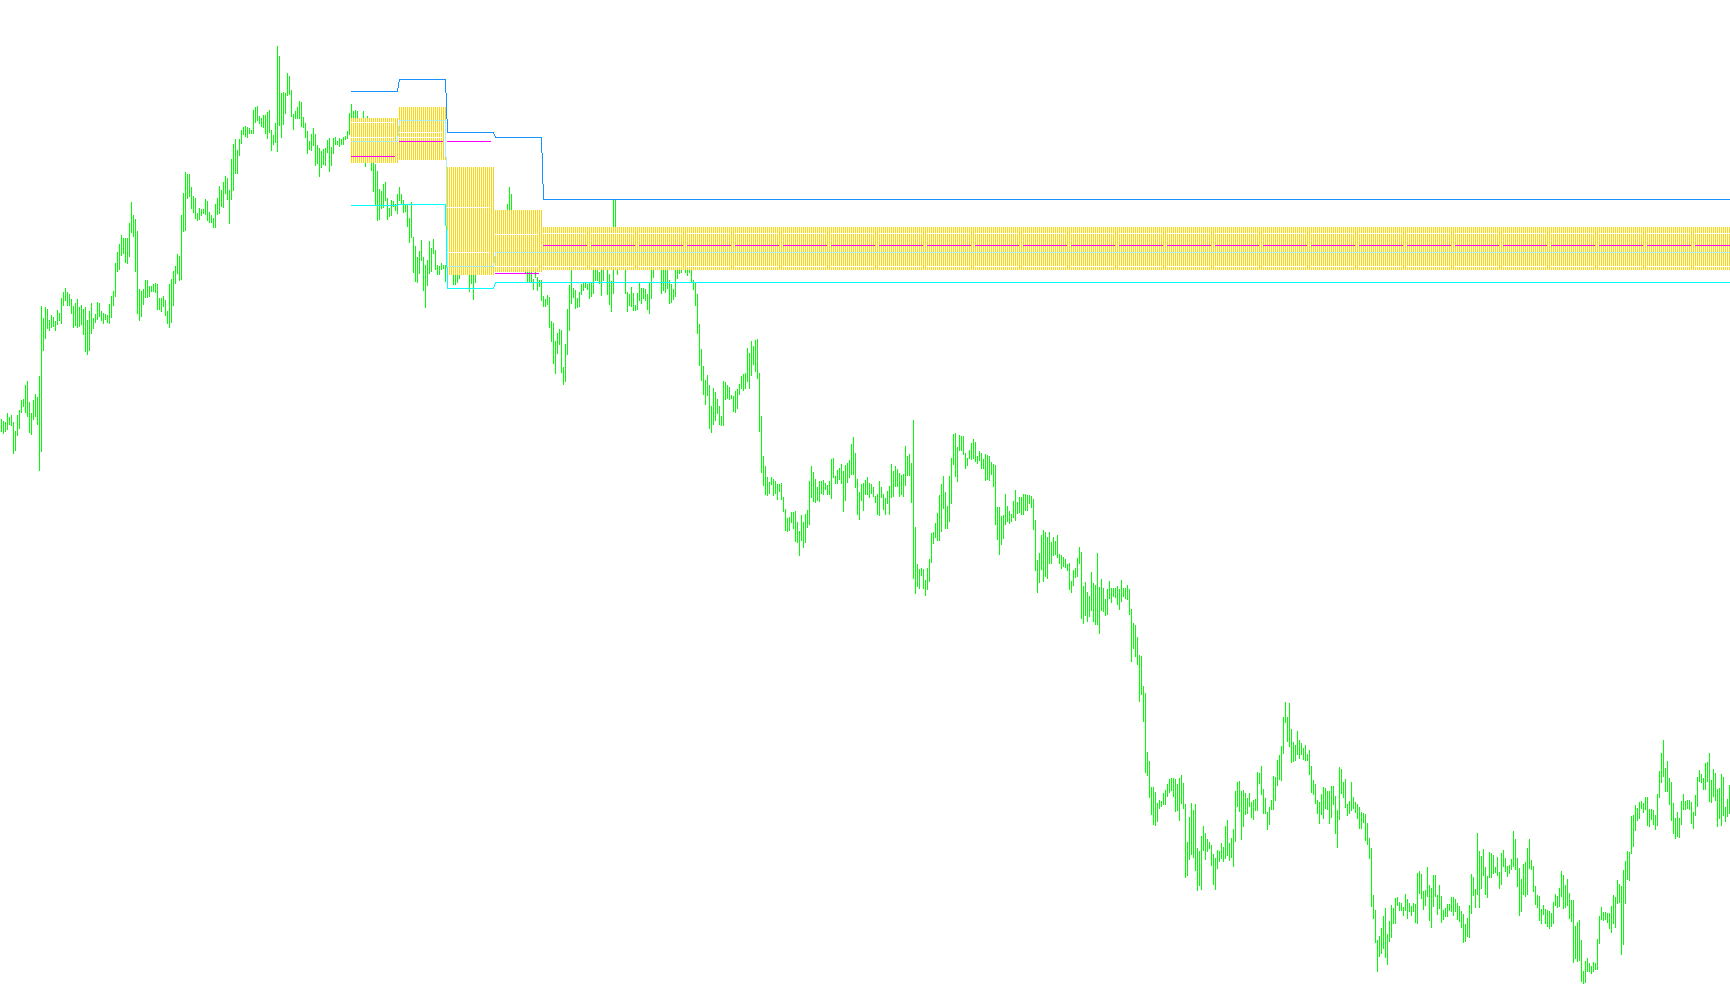
This script is a specialized technical analysis tool designed to visualize historical price behavior and identify significant trading levels, such as support and resistance zones, by using a "Price Histogram" methodology.
Instead of simply looking at recent price candles, this logic analyzes the distribution of price action over a specific period (customizable by the user) to see where the market has spent the most time or exhibited the most activity.
Core Logic Overview
1. Data Collection and Binning The script looks back at a defined number of days to gather high, low, and volume data. It then "bins" this price action into a histogram. Imagine taking all the price movement from the last few days and grouping it into vertical columns (like a bar chart). The more activity occurs at a specific price level, the higher that "bin" becomes in the histogram.
2. Peak Identification Once the histogram is built, the script searches for "peaks"—the points where price activity is most concentrated. These peaks represent significant price zones where the market has historically struggled to move through or has frequently returned to. The tool identifies multiple peaks to distinguish between different levels of importance.
3. Dynamic Level Calculation (Support & Resistance) From the highest identified peak (the "Top"), the script calculates several key levels based on volume distribution:
- Primary Levels (R1, S1): These represent the immediate support and resistance levels surrounding the main price concentration.
- Secondary Levels (R2, S2): These are broader levels calculated using a wider percentage of the total volume, identifying deeper areas of historical interest.
- Top Level: This marks the absolute highest point of historical concentration within the selected timeframe.
4. Visual Representation The indicator draws these findings directly on your chart:
- Histograms/Lines: It plots these calculated levels as distinct lines and markers.
- Persistence: The script is designed to hold these levels steady until a new calculation period begins (based on the user-defined calculation hour), ensuring that the visual data remains clean and readable while the market moves.
Summary of Functionality
For a trader, this tool serves as a "memory map" of the market. By calculating where historical volume and price have clustered most densely, it highlights zones where price is likely to react, allowing you to visualize key areas of supply (Resistance) and demand (Support) based on actual historical density rather than just recent price spikes.
//+------------------------------------------------------------------+
//|                                        PriceHistgram_channel.mq4 |
//|        PriceHistgram_channel              Copyright 2015, fxborg |
//|                                  http://blog.livedoor.jp/fxborg/ |
//+------------------------------------------------------------------+
#property copyright "Copyright 2015, fxborg"
#property link      "http://blog.livedoor.jp/fxborg/"
#property version   "1.00"
#property strict
#property indicator_chart_window
#property indicator_buffers 8
//---
#property indicator_type1 DRAW_HISTOGRAM
#property indicator_type2 DRAW_HISTOGRAM
#property indicator_type3 DRAW_LINE
#property indicator_type4 DRAW_LINE
#property indicator_type5 DRAW_LINE
#property indicator_type6 DRAW_LINE
#property indicator_type7 DRAW_LINE
#property indicator_type8 DRAW_LINE
//---
#property indicator_color1 YellowGreen
#property indicator_color2 YellowGreen
#property indicator_color3 Red
#property indicator_color4 Green
#property indicator_color5 Green
#property indicator_color6 DodgerBlue
#property indicator_color7 DodgerBlue
#property indicator_color8 DodgerBlue
//---
#property indicator_label1 "R1"
#property indicator_label2 "S1"
#property indicator_label3 "Top"
#property indicator_label4 "R2"
#property indicator_label5 "S2"
//---
#property indicator_width1 1
#property indicator_width2 1
#property indicator_width3 3
#property indicator_width4 1
#property indicator_width5 1
#property indicator_width6 2
#property indicator_width7 2
#property indicator_width8 2
//---
#property indicator_style1 STYLE_DOT
#property indicator_style2 STYLE_DOT
#property indicator_style3 STYLE_SOLID
#property indicator_style4 STYLE_DASH
#property indicator_style5 STYLE_DASH
#property indicator_style6 STYLE_SOLID
#property indicator_style7 STYLE_SOLID
#property indicator_style8 STYLE_SOLID
//--- input parameters
input  int InpCalcTime = 4;    // Calculation Time(hour)
input  int InpDayPeriod = 3;   // Histogram Period(day)
//---
int BinRangeScale=2;
double InpBinRange=5;
double LtBinRange=InpBinRange*BinRangeScale;
//---
int d1_period=24*12;   // for 5min
int st_period=InpDayPeriod*24*12;   // for 5min
int min_rates_total;
//--- indicator buffers
double TOPBuffer[];
double R1Buffer[];
double S1Buffer[];
double R2Buffer[];
double S2Buffer[];
double Peak1Buffer[];
double Peak2Buffer[];
double Peak3Buffer[];
//+------------------------------------------------------------------+
//| Custom indicator initialization function                         |
//+------------------------------------------------------------------+
int OnInit()
  {
//---- Initialization of variables of data calculation starting point
   min_rates_total=1+InpDayPeriod*PeriodSeconds(PERIOD_D1)/PeriodSeconds(PERIOD_CURRENT);
//--- indicator buffers mapping
   IndicatorBuffers(8);
   SetIndexBuffer(0,R1Buffer);
   SetIndexBuffer(1,S1Buffer);
   SetIndexBuffer(2,TOPBuffer);
   SetIndexBuffer(3,R2Buffer);
   SetIndexBuffer(4,S2Buffer);
   SetIndexBuffer(5,Peak1Buffer);
   SetIndexBuffer(6,Peak2Buffer);
   SetIndexBuffer(7,Peak3Buffer);
//---
   PlotIndexSetInteger(0,PLOT_SHIFT,1);
   PlotIndexSetInteger(1,PLOT_SHIFT,1);
   PlotIndexSetInteger(2,PLOT_SHIFT,1);
   PlotIndexSetInteger(3,PLOT_SHIFT,1);
   PlotIndexSetInteger(4,PLOT_SHIFT,1);
   PlotIndexSetInteger(5,PLOT_SHIFT,1);
   PlotIndexSetInteger(6,PLOT_SHIFT,1);
   PlotIndexSetInteger(7,PLOT_SHIFT,1);
//---
   return(INIT_SUCCEEDED);
  }
//+------------------------------------------------------------------+
//| Custom indicator iteration function                              |
//+------------------------------------------------------------------+
int OnCalculate(const int rates_total,
                const int prev_calculated,
                const datetime &time[],
                const double &open[],
                const double &high[],
                const double &low[],
                const double &close[],
                const long &tick_volume[],
                const long &volume[],
                const int &spread[])
  {
//---
   int i,first;
//--- check for bars count
   if(rates_total<=min_rates_total)
      return(0);
//---
   ArraySetAsSeries(TOPBuffer,false);
   ArraySetAsSeries(R1Buffer,false);
   ArraySetAsSeries(S1Buffer,false);
   ArraySetAsSeries(R2Buffer,false);
   ArraySetAsSeries(S2Buffer,false);
   ArraySetAsSeries(Peak1Buffer,false);
   ArraySetAsSeries(Peak2Buffer,false);
   ArraySetAsSeries(Peak3Buffer,false);
//---
   ArraySetAsSeries(high,false);
   ArraySetAsSeries(low,false);
   ArraySetAsSeries(close,false);
   ArraySetAsSeries(time,false);
//---
   first=min_rates_total-1;
   if(first+1<prev_calculated) first=prev_calculated-2;
//---- Main calculation loop of the indicator
   for(i=first; i<rates_total && !IsStopped(); i++)
     {
      bool is_update=false;
      MqlDateTime tm0,tm1;
      TimeToStruct(time[i],tm0);
      TimeToStruct(time[i-1],tm1);
      if(tm1.hour!=tm0.hour && tm0.hour==InpCalcTime)
        {
         int j;
         int  m5peaks[];
         int  m5hist[];
         int offset,limit;
         bool ok=generate_histgram(offset,limit,m5peaks,m5hist,time[i]);
         if(ok)
           {
            int m5peak_cnt=ArraySize(m5peaks);
            if(m5peak_cnt>0)
              {
               double up,dn;
               //--- TOP
               TOPBuffer[i]=(offset+m5peaks[0]*InpBinRange+InpBinRange/2)*_Point;
               //--- R2 S2
               calc_range(dn,up,m5hist,m5peaks[0],offset,InpBinRange,0.9);
               S2Buffer[i]=dn;
               R2Buffer[i]=up;
               //--- R1 S1
               calc_range(dn,up,m5hist,m5peaks[0],offset,InpBinRange,0.6);
               S1Buffer[i]=dn;
               R1Buffer[i]=up;
               //--- LINES
               Peak1Buffer[i-1] = EMPTY_VALUE;
               Peak2Buffer[i-1] = EMPTY_VALUE;
               Peak3Buffer[i-1] = EMPTY_VALUE;
               //---
               int line_cnt=0;
               double peak;
               for(j=1;j<m5peak_cnt;j++)
                 {
                  peak=(offset+m5peaks[j]*InpBinRange+InpBinRange/2) *_Point;
                  line_cnt++;
                  if(line_cnt>3) break;
                  if(line_cnt==1) Peak1Buffer[i] = peak;
                  if(line_cnt==2) Peak2Buffer[i] = peak;
                  if(line_cnt==3) Peak3Buffer[i] = peak;
                 }
               is_update=true;
              }
           }
        }
      if(!is_update)
        {
         R1Buffer[i]  = R1Buffer[i-1];
         S1Buffer[i]  = S1Buffer[i-1];
         R2Buffer[i]  = R2Buffer[i-1];
         S2Buffer[i]  = S2Buffer[i-1];
         TOPBuffer[i] = TOPBuffer[i-1];
         Peak1Buffer[i]=Peak1Buffer[i-1];
         Peak2Buffer[i]=Peak2Buffer[i-1];
         Peak3Buffer[i]=Peak3Buffer[i-1];
        }
     }
//--- return value of prev_calculated for next call
   return(rates_total);
  }
//+------------------------------------------------------------------+
//|                                                                  |
//+------------------------------------------------------------------+
bool generate_histgram(int  &offset,
                       int  &limit,
                       int  &m5peaks[],
                       int  &m5hist[],
                       datetime t)
  {
   double m5high[];
   double m5low[];
   long m5vol[];
   ArraySetAsSeries(m5high,true);
   ArraySetAsSeries(m5low,true);
   ArraySetAsSeries(m5vol,true);
   int m5_len1=CopyTickVolume(Symbol(),PERIOD_M5,t,st_period,m5vol);
   int m5_len2=CopyHigh(Symbol(),PERIOD_M5,t,st_period,m5high);
   int m5_len3=CopyLow (Symbol(),PERIOD_M5,t,st_period,m5low);
//--- check copy count
   bool m5_ok=(st_period==m5_len1 && m5_len1==m5_len2 && m5_len2==m5_len3);
   if(!m5_ok)return (false);
//---
   int st_offset=(int)MathRound(m5low[ArrayMinimum(m5low)]/_Point);
   int st_limit=(int)MathRound(m5high[ArrayMaximum(m5high)]/_Point);
//---
   offset = st_offset;
   limit  = st_limit;
   calc_histgram(m5peaks,m5hist,m5high,m5low,m5vol,offset,limit,InpBinRange,d1_period,st_period);
//---
   return (true);
  }
//+------------------------------------------------------------------+
//| calc histgram                                                    |
//+------------------------------------------------------------------+
bool calc_histgram(int &peaks[],
                   int &hist[],
                   const double  &hi[],
                   const double  &lo[],
                   const long  &vol[],
                   int offset,
                   int limit,
                   double binRange,
                   int fast_count,
                   int slow_count)
  {
//---
   int j,k;
//--- histgram bin steps
   int steps=(int)MathRound((limit-offset)/binRange)+1;
//--- init
   ArrayResize(hist,steps);
   ArrayInitialize(hist,0);
//--- histgram loop
   for(j=slow_count-1;j>=0;j--)
     {
      int l =(int)MathRound(lo[j]/_Point);
      int h =(int)MathRound(hi[j]/_Point);
      int v=(int)MathRound(MathSqrt(MathMin(vol[j],1)));
      //--- fast span weight
      if(j<=fast_count-1) v*=2;
      int min = (int)MathRound((l-offset)/binRange);
      int max = (int)MathRound((h-offset)/binRange);
      //--- for normal
      for(k=min;k<=max;k++)hist[k]+=v;
     }
//--- find peaks
   int work[][2];
//--- find peaks
   int peak_count=find_peaks(work,hist,steps,binRange);
   ArrayResize(peaks,0,peak_count);
   int top=0;
   int cnt=0;
   for(j=0;j<peak_count;j++)
     {
      if(j==0)top=work[j][0];
      if(work[j][0]>top*0.1)
        {
         cnt++;
         ArrayResize(peaks,cnt,peak_count);
         peaks[cnt-1]=work[j][1];
        }
     }
   return(true);
  }
//+------------------------------------------------------------------+
//|  Find peaks                                                      |
//+------------------------------------------------------------------+
int find_peaks(int &peaks[][2],const int  &hist[],int steps,double binrange)
  {
   if(steps<=10)
     {
      ArrayResize(peaks,1);
      peaks[0][1] = ArrayMaximum(hist);
      peaks[0][0] =hist[peaks[0][1]];
      return 1;
     }
   int count=0;
   for(int i=2;i<steps-2;i++)
     {
      int max=MathMax(MathMax(MathMax(MathMax(
                      hist[i-2],hist[i-1]),hist[i]),hist[i+1]),hist[i+2]);
      if(hist[i]==max)
        {
         count++;
         ArrayResize(peaks,count);
         int total=hist[i-2]+hist[i-1]+hist[i]+hist[i+1]+hist[i+2];
         peaks[count-1][0] = total;
         peaks[count-1][1] = i;
        }
     }
   if(count>1) ArraySort(peaks,WHOLE_ARRAY,0,MODE_DESCEND);
//---
   return(count);
  }
//+------------------------------------------------------------------+
//|                                                                  |
//+------------------------------------------------------------------+
void calc_range(double  &under,double &upper,const int &hist[],int top,int offset,double binRange,double rangeRate)
  {
   long h_total = 0;
   long l_total = 0;
   int len=ArraySize(hist);
   long higher=0;
   long lower=0;
   int i;
   for(i=top;i<len;i++) h_total+=hist[i];
   for(i=top;i>=0;i--)l_total+=hist[i];
   int h=i;
   int l=top;
   for(i=top;i<len;i++)
     {
      if(rangeRate*h_total<higher)break;
      higher+=hist[i];
      h=i;
     }
   for(i=top;i>=0;i--)
     {
      if(rangeRate*l_total<lower)break;
      lower+=hist[i];
      l=i;
     }
   upper=(offset + h * binRange + binRange/2)*_Point;
   under=(offset + l * binRange + binRange/2)*_Point;
  }
//+------------------------------------------------------------------+
Comments