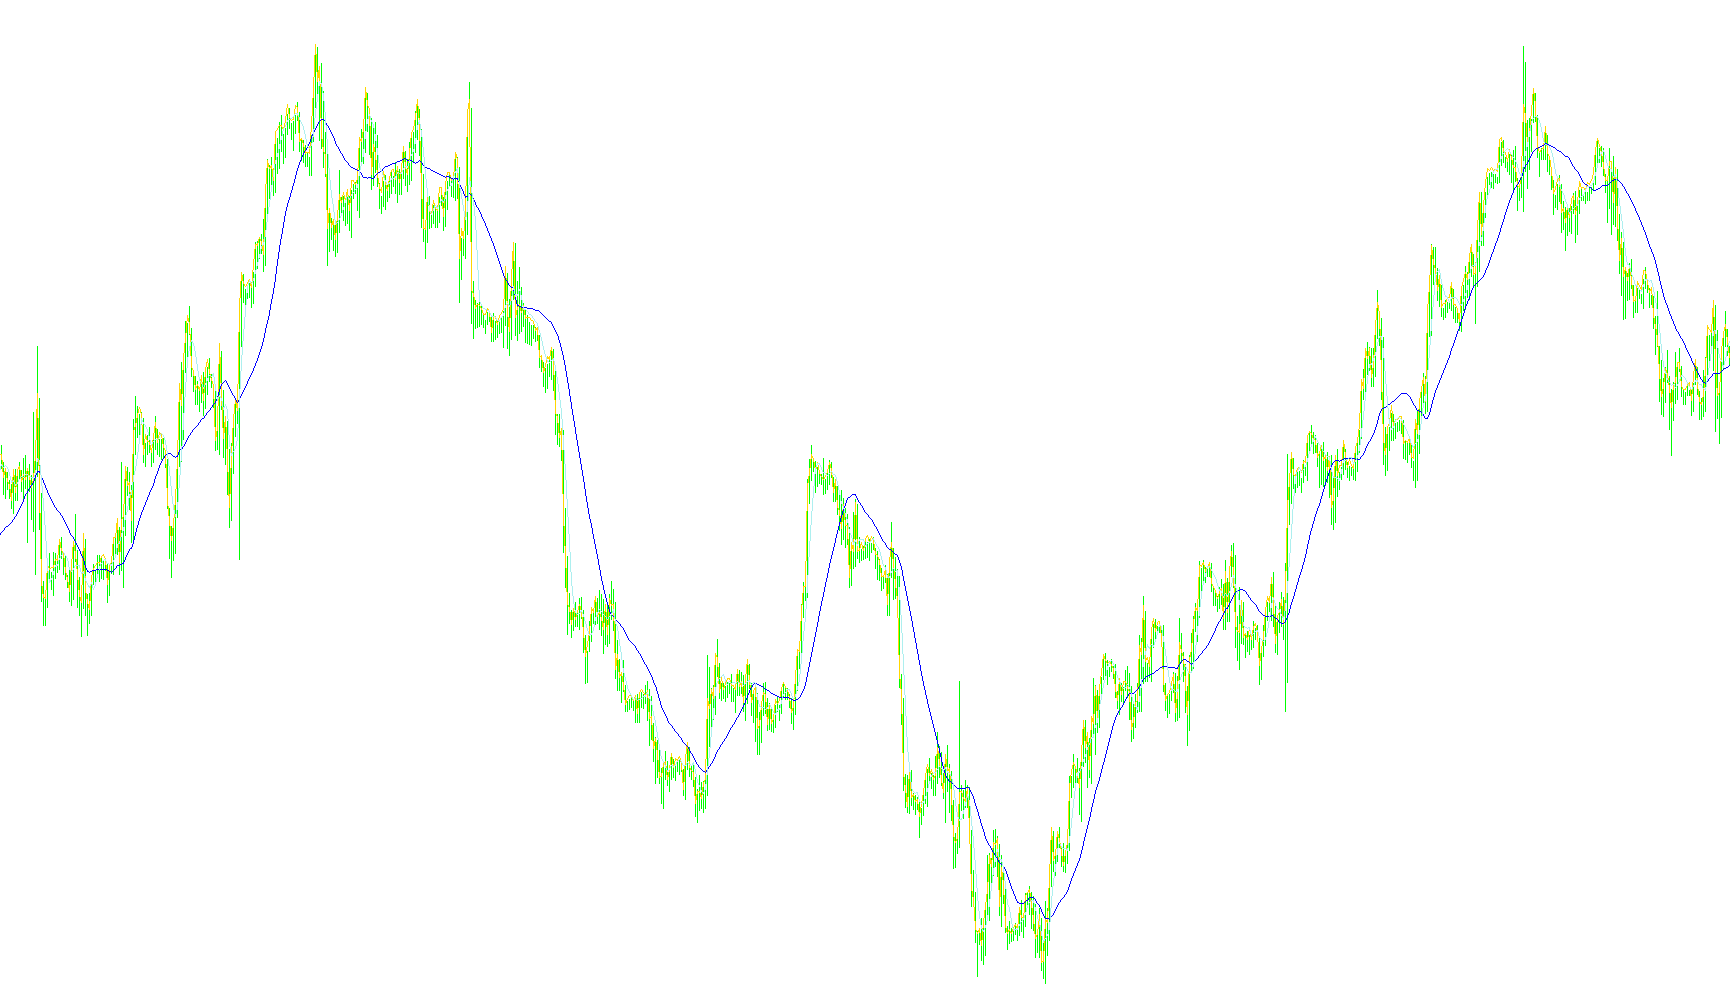
The PriceTrender2 tool is a visual monitoring and notification system designed to help traders track how specific price actions interact with moving averages. Rather than just showing standard price movement, this script focuses on the "crossings"—the exact moments when the market trend shifts in relation to the current price.
Core Functionality
The script works by comparing three distinct data points simultaneously:
- The Market Price: This can be customized to represent various parts of a candle, such as the closing price, opening price, the highest/lowest points reached, or an average of these values.
- Moving Average 1 (MA1): A primary trend indicator based on a longer historical window (defaulting to 24 periods).
- Moving Average 2 (MA2): A secondary trend indicator based on a shorter historical window (defaulting to 5 periods) for faster reaction to market changes.
How the Logic Works
The script continuously scans the historical and real-time data to identify "crosses." It looks for specific mathematical intersections where a moving average moves from one side of the price to the other:
- Upward Crosses: When a moving average moves from below the current price to above it, the script recognizes a potential bullish shift.
- Downward Crosses: When a moving average moves from above the current price to below it, the script recognizes a potential bearish shift.
Key Features
- Multi-Timeframe Analysis: The logic is designed to fetch data from specific timeframes (like H1, M15, etc.), allowing you to monitor trends on a different scale than your primary chart.
- Smart Notifications: To prevent constant "noise," the script includes a logic gate that checks for a "New Bar." This ensures that if a crossover happens during a live candle, you only receive one alert rather than being bombarded with notifications every second the price fluctuates.
- Customizable Price Inputs: Users aren't limited to just looking at the closing price; the logic allows for the calculation of various price types (like the midpoint or the average of high/low/open/close) to determine what constitutes a "cross."
User Experience
For the trader, this means the tool acts as an automated lookout. It visualizes these trends in a separate window and provides instant pop-up alerts when the moving averages break through the price levels, helping you identify potential entry or exit points based on trend reversals.
//+------------------------------------------------------------------+
//|                                                PriceTrender2.mq4 |
//|                                                          Kalenzo |
//|                                      bartlomiej.gorski@gmail.com |
//+------------------------------------------------------------------+
#property copyright "Kalenzo"
#property link      "bartlomiej.gorski@gmail.com"
#property indicator_separate_window
#property indicator_buffers 3
#property indicator_color1 DodgerBlue
#property indicator_color2 Gold
#property indicator_color3 Lime

extern int TimeFrame = 60,
           Price = 0,
           Ma1Type = 0,
           Ma1Price = 0,
           Ma1Length = 24,
           Ma2Type = 0,
           Ma2Price = 0,
           Ma2Length = 5;
extern string note12 = "--------------------------------------------";
extern string note13 = "turn on Alert = true; turn off = false";
extern bool AlertOn = true;


double price[],trend[],trend2[];
string AlertPrefix;


//+------------------------------------------------------------------+
//| Custom indicator initialization function                         |
//+------------------------------------------------------------------+
int init()
  {
//---- indicators
SetIndexBuffer(0,price);
SetIndexBuffer(1,trend);
SetIndexBuffer(2,trend2);

SetIndexStyle(0,DRAW_LINE,STYLE_SOLID,1);
SetIndexStyle(1,DRAW_LINE,STYLE_SOLID,1);
SetIndexStyle(2,DRAW_LINE,STYLE_SOLID,1);

SetIndexLabel(0,"Price");
SetIndexLabel(1,"MA 1");
SetIndexLabel(2,"MA 2");

   AlertPrefix=Symbol()+" ("+GetTimeFrameStr()+"):  ";

//----
   return(0);
  }
//+------------------------------------------------------------------+
//| Custom indicator deinitialization function                       |
//+------------------------------------------------------------------+
int deinit()
  {
//----

//----
   return(0);
  }

string GetTimeFrameStr() {
   switch(Period())
   {
      case 1 : string TimeFrameStr="M1"; break;
      case 5 : TimeFrameStr="M5"; break;
      case 15 : TimeFrameStr="M15"; break;
      case 30 : TimeFrameStr="M30"; break;
      case 60 : TimeFrameStr="H1"; break;
      case 240 : TimeFrameStr="H4"; break;
      case 1440 : TimeFrameStr="D1"; break;
      case 10080 : TimeFrameStr="W1"; break;
      case 43200 : TimeFrameStr="MN1"; break;
      default : TimeFrameStr=Period();
   }
   return (TimeFrameStr);
   }

//+------------------------------------------------------------------+
bool NewBar()
{
   static datetime lastbar;
   datetime curbar = Time[0];
   if(lastbar!=curbar)
   {
      lastbar=curbar;
      return (true);
   }
   else
   {
      return(false);
   }
}

//+------------------------------------------------------------------+
//| Custom indicator iteration function                              |
//+------------------------------------------------------------------+
int start()
  {
   int    limit, bigshift;
   int    counted_bars=IndicatorCounted();
//----
   if (counted_bars<0) return(-1);
   if (counted_bars>0) counted_bars--;
   limit=Bars-counted_bars;

   for (int i=limit; i>=0; i--)
   {
      bigshift = iBarShift(Symbol(),TimeFrame,Time[i]);

      price[i] = getPrice(bigshift);
      trend[i] = iMA(Symbol(),TimeFrame,Ma1Length,0,Ma1Type,Ma1Price,bigshift);
      trend2[i] = iMA(Symbol(),TimeFrame,Ma2Length,0,Ma2Type,Ma2Price,bigshift);
      if ((trend[i] > price[i]) && (trend[i+1] < price[i+1]))
      {
           if (NewBar())
         {
             if (AlertOn) Alert(AlertPrefix + " MA1 " + "crosses UP price");
  	      }
      }
      if ((trend[i] < price[i]) && (trend[i+1] > price[i+1]))
      {
         if (NewBar())
         {
             if (AlertOn) Alert(AlertPrefix+ " MA1 " + "crosses DOWN price");
  	      }
     }
      if ((trend2[i] > price[i]) && (trend2[i+1] < price[i+1]))
      {
           if (NewBar())
         {
             if (AlertOn) Alert(AlertPrefix + " MA2 " + "crosses UP price");
  	      }
      }
      if ((trend2[i] < price[i]) && (trend2[i+1] > price[i+1]))
      {
         if (NewBar())
         {
             if (AlertOn) Alert(AlertPrefix+ " MA2 " + "crosses DOWN price");
  	      }
     }
   }

//----

   return(0);
  }

//+------------------------------------------------------------------+
double getPrice(int shift)
{
   switch(Price)
   {
      case 0 : return ( iClose(Symbol(),TimeFrame,shift) );
      case 1 : return (iOpen(Symbol(),TimeFrame,shift));
      case 2 : return (iHigh(Symbol(),TimeFrame,shift));
      case 3 : return (iLow(Symbol(),TimeFrame,shift));
      case 4 : return ((iLow(Symbol(),TimeFrame,shift)+iHigh(Symbol(),TimeFrame,shift))/2);
      case 5 : return ((iClose(Symbol(),TimeFrame,shift)+iLow(Symbol(),TimeFrame,shift)+iHigh(Symbol(),TimeFrame,shift))/3);
      case 6 : return ((iOpen(Symbol(),TimeFrame,shift)+iClose(Symbol(),TimeFrame,shift)+iLow(Symbol(),TimeFrame,shift)+iHigh(Symbol(),TimeFrame,shift))/4);
   }
}
Comments