Pro4x Pivot Lines_v1
Download script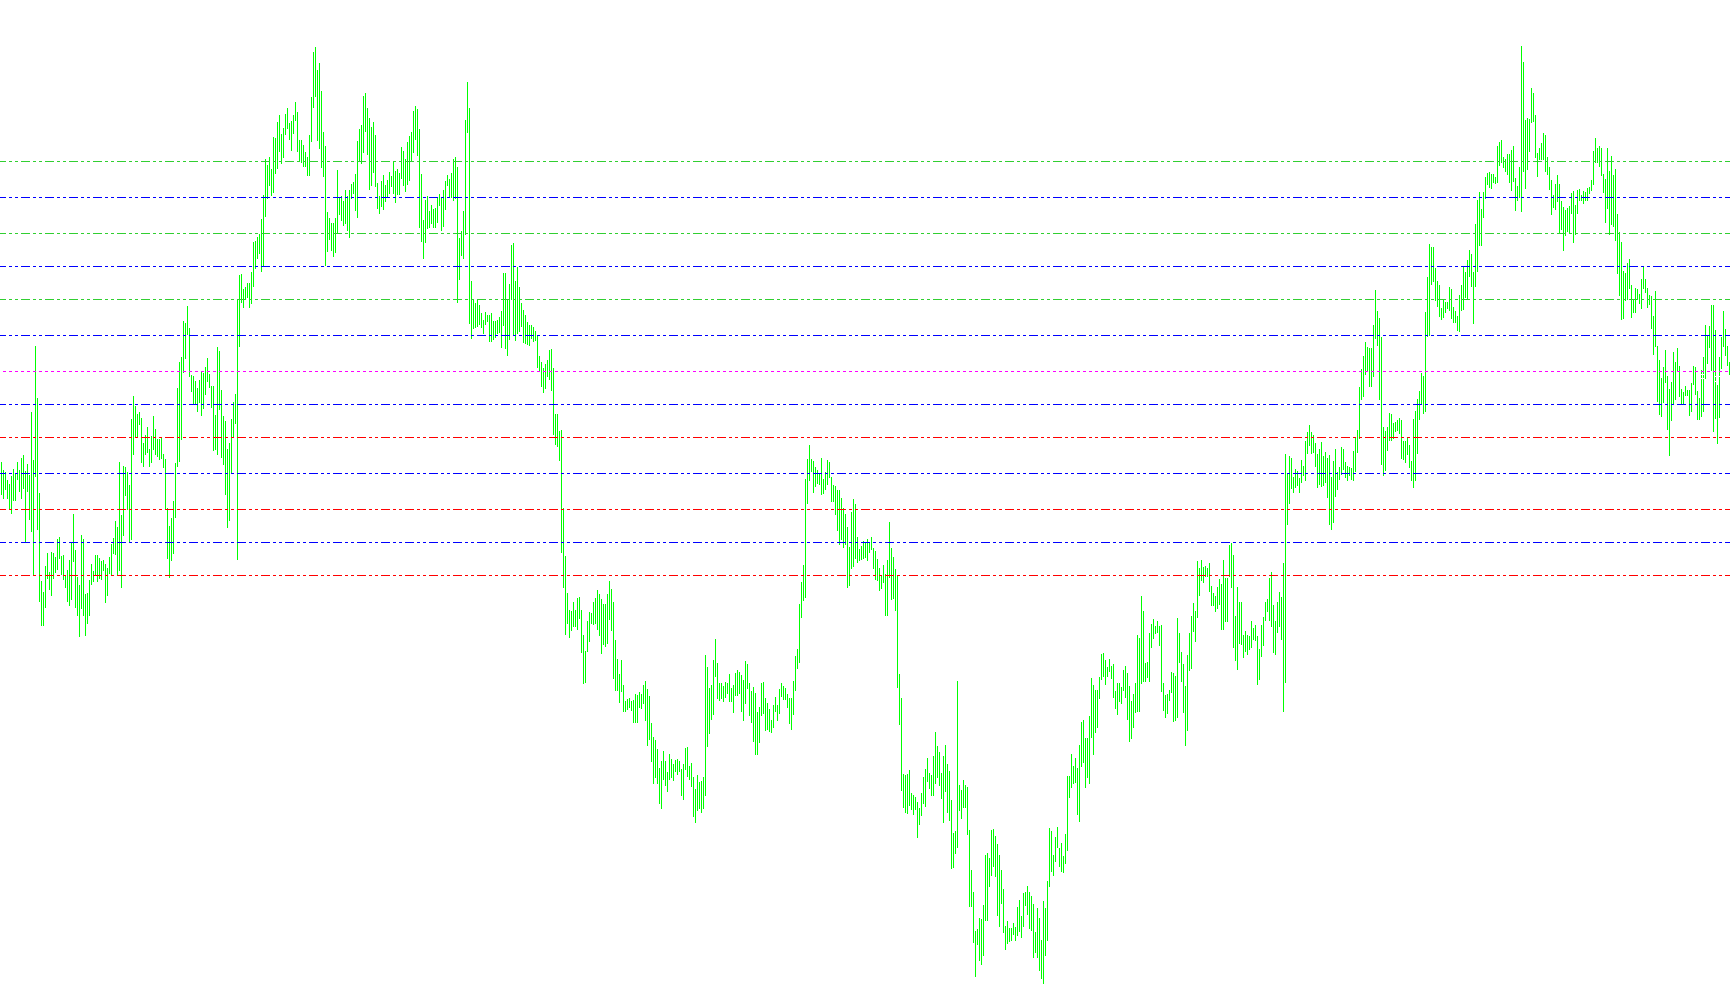
This script is designed for traders using the MetaTrader platform to automatically identify and display key technical price levels on their charts. Rather than requiring manual calculation, it scans historical data to plot specific "pivot" points, which are often used by market participants to determine support and resistance zones.
Core Functionality
The script identifies three distinct types of technical price levels based on previous trading activity:
1. Standard Pivot Points The tool calculates the primary "Pivot" (the central balance point) based on the previous day's high, low, and closing prices. From this central point, it generates:
- Resistance Levels (R1, R2, R3): Potential ceilings where price might face selling pressure.
- Support Levels (S1, S2, S3): Potential floors where price might find buying interest.
2. Camarilla Breakout Levels This section provides specialized levels (H3, H4, L3, L4) which are frequently used by traders to identify potential breakout zones or "trading ranges." These are calculated using a specific ratio of the previous day's range and closing price.
3. Midpoint Pivots For more granular analysis, the script can display intermediate levels (M0 through M5). These break down the larger gaps between the primary support and resistance zones, helping traders identify "sub-zones" within a trend.
Key Features & User Experience
- Automatic Data Retrieval: The script automatically pulls the high, low, and open/close prices from the previous day to ensure the levels are always current. It includes specific logic to handle transitions between days of the week (e.g., recognizing when a weekend occurs).
- Visual Customization: Each type of level is assigned a distinct visual style and color:
- Standard Pivots: Use Lime Green for resistance and Red for support, with a Magenta line for the central Pivot.
- Camarilla Levels: Displayed in Yellow.
- Midpoints: Displayed in Blue.
- On-Screen Information: The script provides a real-time dashboard comment at the top of your chart. This displays the previous day's high, low, and range, as well as a countdown timer showing exactly how many minutes and seconds remain until the next candle opens.
- Safety Controls: To prevent visual clutter and errors, the script includes a check to ensure it only runs on timeframes smaller than one day (e.g., hourly, 15-minute, or 5-minute charts). If you attempt to use it on a weekly or monthly chart, it will provide an error message.
Summary for the Trader
This tool eliminates the need to do math during your trading session. By simply placing it on your chart, you get a complete map of where "battlegrounds" (support and resistance) are likely to form based on yesterday's price action, organized into three different popular trading methodologies all in one view.
/*-----------------------------+
|			       |
| Shared by www.Aptrafx.com    |
|			       |
+------------------------------*/

//+------------------------------------------------------------------+
//|                                                        Pivot.mq4 |
//|                      Copyright © 004, MetaQuotes Software Corp. |
//|                                        http://www.metaquotes.net |
//+------------------------------------------------------------------+
#property copyright "Copyright © 004, MetaQuotes Software Corp."
#property link      "http://www.metaquotes.net"

#property indicator_chart_window
#property indicator_buffers 1
#property indicator_color1 CLR_NONE


extern bool pivots = true;
extern bool camarilla = false;
extern bool midpivots = true;


double day_high=0;
double day_low=0;
double yesterday_high=0;
double yesterday_open=0;
double yesterday_low=0;
double yesterday_close=0;
double today_open=0;
double today_high=0;
double today_low=0;
double P=0;
double Q=0;
double R1,R2,R3;
double M0,M1,M2,M3,M4,M5;
double S1,S2,S3;
double H4,H3,L4,L3;
double nQ=0;
double nD=0;
double D=0;
double rates_d1[2][6];
double ExtMapBuffer1[];
//+------------------------------------------------------------------+
//| Custom indicator initialization function                         |
//+------------------------------------------------------------------+
int init()
  {
  IndicatorBuffers(4);
SetIndexStyle(0,DRAW_ARROW);
SetIndexArrow(0,159);
SetIndexBuffer(0, ExtMapBuffer1);
#property indicator_color1 CLR_NONE
//---- indicators
 R1=0; R2=0; R3=0;
 M0=0; M1=0; M2=0; M3=0; M4=0; M5=0;
 S1=0; S2=0; S3=0;
 H4=0; H3=0; L4=0; L3=0;


//----
   return(0);
  }
//+------------------------------------------------------------------+
//| Custor indicator deinitialization function                       |
//+------------------------------------------------------------------+
int deinit()
  {
//---- TODO: add your code here
ObjectDelete("R1 Label");
ObjectDelete("R1 Line");
ObjectDelete("R2 Label");
ObjectDelete("R2 Line");
ObjectDelete("R3 Label");
ObjectDelete("R3 Line");
ObjectDelete("S1 Label");
ObjectDelete("S1 Line");
ObjectDelete("S2 Label");
ObjectDelete("S2 Line");
ObjectDelete("S3 Label");
ObjectDelete("S3 Line");
ObjectDelete("P Label");
ObjectDelete("P Line");
ObjectDelete("H4 Label");
ObjectDelete("H4 Line");
ObjectDelete("H3 Label");
ObjectDelete("H3 Line");
ObjectDelete("L3 Label");
ObjectDelete("L3 Line");
ObjectDelete("L4 Label");
ObjectDelete("L4 Line");
ObjectDelete("M5 Label");
ObjectDelete("M5 Line");
ObjectDelete("M4 Label");
ObjectDelete("M4 Line");
ObjectDelete("M3 Label");
ObjectDelete("M3 Line");
ObjectDelete("M2 Label");
ObjectDelete("M2 Line");
ObjectDelete("M1 Label");
ObjectDelete("M1 Line");
ObjectDelete("M0 Label");
ObjectDelete("M0 Line");
//----
   return(0);
  }
//+------------------------------------------------------------------+
//| Custom indicator iteration function                              |
//+------------------------------------------------------------------+
int start()
  {


//---- TODO: add your code here

//---- exit if period is greater than daily charts
if(Period() > 1440)
{
Print("Error - Chart period is greater than 1 day.");
return(-1); // then exit
}

//---- Get new daily prices

ArrayCopyRates(rates_d1, Symbol(), PERIOD_D1);

Print("day of week = ",DayOfWeek());
if(DayOfWeek()==1)
{
   yesterday_close = rates_d1[3][4];
   Print("yesterdays close = ",yesterday_close);
   yesterday_open = rates_d1[3][1];
   today_open = rates_d1[0][3];
   yesterday_high = rates_d1[3][3];
   yesterday_low = rates_d1[3][2];
   day_high = rates_d1[0][3];
   day_low = rates_d1[0][2];
} else
{
   yesterday_close = rates_d1[1][4];
   yesterday_open = rates_d1[1][1];
   today_open = rates_d1[0][1];
   yesterday_high = rates_d1[1][3];
   yesterday_low = rates_d1[1][2];
   day_high = rates_d1[0][3];
   day_low = rates_d1[0][2];
}

//---- Calculate Pivots

D = (day_high - day_low);
Q = (yesterday_high - yesterday_low);
P = (yesterday_high + yesterday_low + yesterday_close) / 3;
R1 = (2*P)-yesterday_low;
S1 = (2*P)-yesterday_high;
R2 = P+(yesterday_high - yesterday_low);
S2 = P-(yesterday_high - yesterday_low);

	H4 = (Q*0.55)+yesterday_close;
	H3 = (Q*0.27)+yesterday_close;
	R3 = (2*P)+(yesterday_high-(2*yesterday_low));
	M5 = (R2+R3)/2;
//	R2 = P-S1+R1;
	M4 = (R1+R2)/2;
//	R1 = (2*P)-yesterday_low;
	M3 = (P+R1)/2;
//	P = (yesterday_high + yesterday_low + yesterday_close)/3;
	M2 = (P+S1)/2;
//	S1 = (2*P)-yesterday_high;
	M1 = (S1+S2)/2;
//	S2 = P-R1+S1;
	S3 = (2*P)-((2* yesterday_high)-yesterday_low);
	L3 = yesterday_close-(Q*0.27);
	L4 = yesterday_close-(Q*0.55);
	M0 = (S2+S3)/2;

if (Q > 5)
{
	nQ = Q;
}
else
{
	nQ = Q*10000;
}

if (D > 5)
{
	nD = D;
}
else
{
	nD = D*10000;
}


//Comment("High= ",yesterday_high,"    Previous Days Range= ",nQ,"\nLow= ",yesterday_low,"    Current Days Range= ",nD,"\nClose= ",yesterday_close);

double seco= (Time[4]-Time[5])-MathMod(CurTime(),Time[4]-Time[5]);
double minu=seco/60;
seco=(minu-MathFloor(minu))*60;
minu=MathFloor(minu);

Comment("High= ",yesterday_high,"    Previous Days Range= ",nQ,"\nLow= ",yesterday_low,"    Current Days Range= ",nD,"\nClose= ",yesterday_close,"\nTime for next bar: ",	minu," min ",seco," sec");

//---- Set line labels on chart window

//---- Pivot Lines
   if (pivots==true)
   {
      if(ObjectFind("R1 label") != 0)
      {
      ObjectCreate("R1 label", OBJ_TEXT, 0, Time[0], R1);
      ObjectSetText("R1 label", " R1", 8, "Arial", EMPTY);
      }
      else
      {
      ObjectMove("R1 label", 0, Time[0], R1);
      }

      if(ObjectFind("R2 label") != 0)
      {
      ObjectCreate("R2 label", OBJ_TEXT, 0, Time[0], R2);
      ObjectSetText("R2 label", " R2", 8, "Arial", EMPTY);
      }
      else
      {
      ObjectMove("R2 label", 0, Time[0], R2);
      }

      if(ObjectFind("R3 label") != 0)
      {
      ObjectCreate("R3 label", OBJ_TEXT, 0, Time[0], R3);
      ObjectSetText("R3 label", " R3", 8, "Arial", EMPTY);
      }
      else
      {
      ObjectMove("R3 label", 0, Time[0], R3);
      }

      if(ObjectFind("P label") != 0)
      {
      ObjectCreate("P label", OBJ_TEXT, 0, Time[0], P);
      ObjectSetText("P label", "Pivot  " +DoubleToStr(P,4), 8, "Arial", EMPTY);
      }
      else
      {
      ObjectMove("P label", 0, Time[0], P);
      }

      if(ObjectFind("S1 label") != 0)
      {
      ObjectCreate("S1 label", OBJ_TEXT, 0, Time[0], S1);
      ObjectSetText("S1 label", "S1", 8, "Arial", EMPTY);
      }
      else
      {
      ObjectMove("S1 label", 0, Time[0], S1);
      }

      if(ObjectFind("S2 label") != 0)
      {
      ObjectCreate("S2 label", OBJ_TEXT, 0, Time[0], S2);
      ObjectSetText("S2 label", "S2", 8, "Arial", EMPTY);
      }
      else
      {
      ObjectMove("S2 label", 0, Time[0], S2);
      }

      if(ObjectFind("S3 label") != 0)
      {
      ObjectCreate("S3 label", OBJ_TEXT, 0, Time[0], S3);
      ObjectSetText("S3 label", "S3", 8, "Arial", EMPTY);
      }
      else
      {
      ObjectMove("S3 label", 0, Time[0], S3);
      }

//---  Draw  Pivot lines on chart
      if(ObjectFind("S1 line") != 0)
      {
      ObjectCreate("S1 line", OBJ_HLINE, 0, Time[40], S1);
      ObjectSet("S1 line", OBJPROP_STYLE, STYLE_DASHDOTDOT);
      ObjectSet("S1 line", OBJPROP_COLOR, Red);
      }
      else
      {
      ObjectMove("S1 line", 0, Time[40], S1);
      //ObjectSet("S1 line", OBJPROP_COLOR, indicator_color1);
      }

      if(ObjectFind("S2 line") != 0)
      {
      ObjectCreate("S2 line", OBJ_HLINE, 0, Time[40], S2);
      ObjectSet("S2 line", OBJPROP_STYLE, STYLE_DASHDOTDOT);
      ObjectSet("S2 line", OBJPROP_COLOR, Red);
      }
      else
      {
      ObjectMove("S2 line", 0, Time[40], S2);
      }

      if(ObjectFind("S3 line") != 0)
      {
      ObjectCreate("S3 line", OBJ_HLINE, 0, Time[40], S3);
      ObjectSet("S3 line", OBJPROP_STYLE, STYLE_DASHDOTDOT);
      ObjectSet("S3 line", OBJPROP_COLOR, Red);
      }
      else
      {
      ObjectMove("S3 line", 0, Time[40], S3);
      }

      if(ObjectFind("P line") != 0)
      {
      ObjectCreate("P line", OBJ_HLINE, 0, Time[40], P);
      ObjectSet("P line", OBJPROP_STYLE, STYLE_DOT);
      ObjectSet("P line", OBJPROP_COLOR, Magenta);
      }
      else
      {
      ObjectMove("P line", 0, Time[40], P);
      }

      if(ObjectFind("R1 line") != 0)
      {
      ObjectCreate("R1 line", OBJ_HLINE, 0, Time[40], R1);
      ObjectSet("R1 line", OBJPROP_STYLE, STYLE_DASHDOTDOT);
      ObjectSet("R1 line", OBJPROP_COLOR, LimeGreen);
      }
      else
      {
      ObjectMove("R1 line", 0, Time[40], R1);
      }

      if(ObjectFind("R2 line") != 0)
      {
      ObjectCreate("R2 line", OBJ_HLINE, 0, Time[40], R2);
      ObjectSet("R2 line", OBJPROP_STYLE, STYLE_DASHDOTDOT);
      ObjectSet("R2 line", OBJPROP_COLOR, LimeGreen);
      }
      else
      {
      ObjectMove("R2 line", 0, Time[40], R2);
      }

      if(ObjectFind("R3 line") != 0)
      {
      ObjectCreate("R3 line", OBJ_HLINE, 0, Time[40], R3);
      ObjectSet("R3 line", OBJPROP_STYLE, STYLE_DASHDOTDOT);
      ObjectSet("R3 line", OBJPROP_COLOR, LimeGreen);
      }
      else
      {
      ObjectMove("R3 line", 0, Time[40], R3);
      }
   }
//---- End of Pivot Line Draw


//----- Camarilla Lines

   if (camarilla==true)
   {
      if(ObjectFind("H4 label") != 0)
      {
      ObjectCreate("H4 label", OBJ_TEXT, 0, Time[0], H4);
      ObjectSetText("H4 label", " H4", 8, "Arial", EMPTY);
      }
      else
      {
      ObjectMove("H4 label", 0, Time[0], H4);
      }

      if(ObjectFind("H3 label") != 0)
      {
      ObjectCreate("H3 label", OBJ_TEXT, 0, Time[0], H3);
      ObjectSetText("H3 label", " H3", 8, "Arial", EMPTY);
      }
      else
      {
      ObjectMove("H3 label", 0, Time[0], H3);
      }

      if(ObjectFind("L3 label") != 0)
      {
      ObjectCreate("L3 label", OBJ_TEXT, 0, Time[0], L3);
      ObjectSetText("L3 label", " L3", 8, "Arial", EMPTY);
      }
      else
      {
      ObjectMove("L3 label", 0, Time[0], L3);
      }

      if(ObjectFind("L4 label") != 0)
      {
      ObjectCreate("L4 label", OBJ_TEXT, 0, Time[0], L4);
      ObjectSetText("L4 label", " L4", 8, "Arial", EMPTY);
      }
      else
      {
      ObjectMove("L4 label", 0, Time[0], L4);
      }

//---- Draw Camarilla lines on Chart
      if(ObjectFind("H4 line") != 0)
      {
      ObjectCreate("H4 line", OBJ_HLINE, 0, Time[40], H4);
      ObjectSet("H4 line", OBJPROP_STYLE, STYLE_DASHDOTDOT);
      ObjectSet("H4 line", OBJPROP_COLOR, Yellow);
      }
      else
      {
      ObjectMove("H4 line", 0, Time[40], H4);
      }

      if(ObjectFind("H3 line") != 0)
      {
      ObjectCreate("H3 line", OBJ_HLINE, 0, Time[40], H3);
      ObjectSet("H3 line", OBJPROP_STYLE, STYLE_DASHDOTDOT);
      ObjectSet("H3 line", OBJPROP_COLOR, Yellow);
      }
      else
      {
      ObjectMove("H3 line", 0, Time[40], H3);
      }

      if(ObjectFind("L3 line") != 0)
      {
      ObjectCreate("L3 line", OBJ_HLINE, 0, Time[40], L3);
      ObjectSet("L3 line", OBJPROP_STYLE, STYLE_DASHDOTDOT);
      ObjectSet("L3 line", OBJPROP_COLOR, Yellow);
      }
      else
      {
      ObjectMove("L3 line", 0, Time[40], L3);
      }

      if(ObjectFind("L4 line") != 0)
      {
      ObjectCreate("L4 line", OBJ_HLINE, 0, Time[40], L4);
      ObjectSet("L4 line", OBJPROP_STYLE, STYLE_DASHDOTDOT);
      ObjectSet("L4 line", OBJPROP_COLOR, Yellow);
      }
      else
      {
      ObjectMove("L4 line", 0, Time[40], L4);
      }
   }
//-------End of Draw Camarilla Lines

//------ Midpoints Pivots

   if (midpivots==true)
   {

      if(ObjectFind("M5 label") != 0)
      {
      ObjectCreate("M5 label", OBJ_TEXT, 0, Time[0], M5);
      ObjectSetText("M5 label", " M5", 8, "Arial", EMPTY);
      }
      else
      {
      ObjectMove("M5 label", 0, Time[0], M5);
      }

      if(ObjectFind("M4 label") != 0)
      {
      ObjectCreate("M4 label", OBJ_TEXT, 0, Time[0], M4);
      ObjectSetText("M4 label", " M4", 8, "Arial", EMPTY);
      }
      else
      {
      ObjectMove("M4 label", 0, Time[0], M4);
      }

      if(ObjectFind("M3 label") != 0)
      {
      ObjectCreate("M3 label", OBJ_TEXT, 0, Time[0], M3);
      ObjectSetText("M3 label", " M3", 8, "Arial", EMPTY);
      }
      else
      {
      ObjectMove("M3 label", 0, Time[0], M3);
      }

      if(ObjectFind("M2 label") != 0)
      {
      ObjectCreate("M2 label", OBJ_TEXT, 0, Time[0], M2);
      ObjectSetText("M2 label", " M2", 8, "Arial", EMPTY);
      }
      else
      {
      ObjectMove("M2 label", 0, Time[0], M2);
      }

      if(ObjectFind("M1 label") != 0)
      {
      ObjectCreate("M1 label", OBJ_TEXT, 0, Time[0], M1);
      ObjectSetText("M1 label", " M1", 8, "Arial", EMPTY);
      }
      else
      {
      ObjectMove("M1 label", 0, Time[0], M1);
      }

      if(ObjectFind("M0 label") != 0)
      {
      ObjectCreate("M0 label", OBJ_TEXT, 0, Time[0], M0);
      ObjectSetText("M0 label", " M0", 8, "Arial", EMPTY);
      }
      else
      {
      ObjectMove("M0 label", 0, Time[0], M0);
      }

//---- Draw Midpoint Pivots on Chart
      if(ObjectFind("M5 line") != 0)
      {
      ObjectCreate("M5 line", OBJ_HLINE, 0, Time[40], M5);
      ObjectSet("M5 line", OBJPROP_STYLE, STYLE_DASHDOTDOT);
      ObjectSet("M5 line", OBJPROP_COLOR, Blue);
      }
      else
      {
      ObjectMove("M5 line", 0, Time[40], M5);
      }

      if(ObjectFind("M4 line") != 0)
      {
      ObjectCreate("M4 line", OBJ_HLINE, 0, Time[40], M4);
      ObjectSet("M4 line", OBJPROP_STYLE, STYLE_DASHDOTDOT);
      ObjectSet("M4 line", OBJPROP_COLOR, Blue);
      }
      else
      {
      ObjectMove("M4 line", 0, Time[40], M4);
      }

      if(ObjectFind("M3 line") != 0)
      {
      ObjectCreate("M3 line", OBJ_HLINE, 0, Time[40], M3);
      ObjectSet("M3 line", OBJPROP_STYLE, STYLE_DASHDOTDOT);
      ObjectSet("M3 line", OBJPROP_COLOR, Blue);
      }
      else
      {
      ObjectMove("M3 line", 0, Time[40], M3);
      }

      if(ObjectFind("M2 line") != 0)
      {
      ObjectCreate("M2 line", OBJ_HLINE, 0, Time[40], M2);
      ObjectSet("M2 line", OBJPROP_STYLE, STYLE_DASHDOTDOT);
      ObjectSet("M2 line", OBJPROP_COLOR, Blue);
      }
      else
      {
      ObjectMove("M2 line", 0, Time[40], M2);
      }

      if(ObjectFind("M1 line") != 0)
      {
      ObjectCreate("M1 line", OBJ_HLINE, 0, Time[40], M1);
      ObjectSet("M1 line", OBJPROP_STYLE, STYLE_DASHDOTDOT);
      ObjectSet("M1 line", OBJPROP_COLOR, Blue);
      }
      else
      {
      ObjectMove("M1 line", 0, Time[40], M1);
      }

      if(ObjectFind("M0 line") != 0)
      {
      ObjectCreate("M0 line", OBJ_HLINE, 0, Time[40], M0);
      ObjectSet("M0 line", OBJPROP_STYLE, STYLE_DASHDOTDOT);
      ObjectSet("M0 line", OBJPROP_COLOR, Blue);
      }
      else
      {
      ObjectMove("M0 line", 0, Time[40], M0);
      }

   }
//----End of Midpoint Pivots Draw

//---- End Of Program
   return(0);
//#include "comment.mq4"

  }
//+------------------------------------------------------------------+
Comments