qsiLagrange
Download script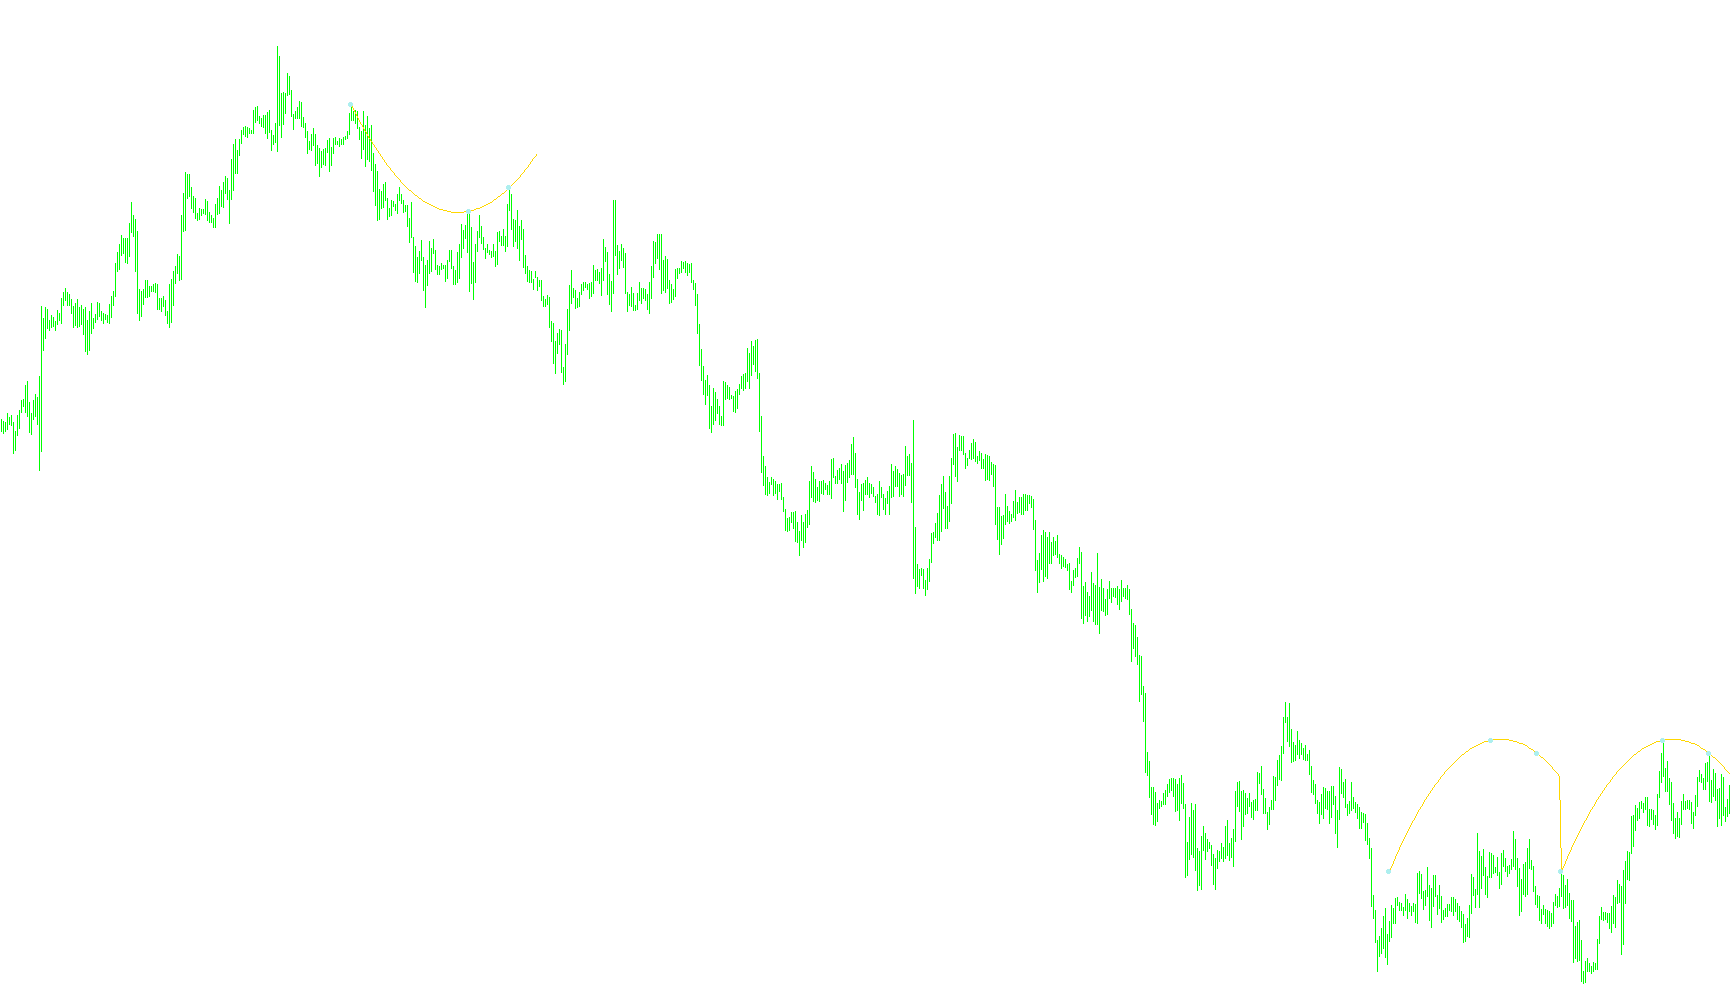
This indicator is designed to analyze price action by identifying significant structural turning points and using them to project a mathematical curve onto the market chart. Instead of simply following the current price, it seeks to understand the underlying "shape" of the trend based on historical highs or lows.
Core Logic and Mechanism
The script operates through three primary logical phases:
1. Identification of Anchor Points The tool begins by scanning historical price data to find significant peaks or valleys. It doesn't just look at every high or low; it uses a specific "depth" setting to ensure it only selects points that are prominent relative to the bars surrounding them. By doing this, the script filters out minor market noise and identifies the major structural "hinges" of the price movement.
2. Polynomial Curve Fitting (Lagrange Method) Once these significant anchor points are identified, the script applies a mathematical technique known as Lagrange Interpolation. Think of this as drawing a smooth, continuous curve that perfectly touches every one of the identified anchor points.
- The "Power" setting determines how complex this curve can be. A higher power allows the curve to bend more to fit more points, while a lower power results in a smoother, more generalized path.
- This creates a mathematical representation of the price history that reflects the organic flow of the market rather than jagged, individual price bars.
3. Visual Projection and Forecasting The indicator provides three distinct visual outputs on your chart:
- Historical Curve: A line that traces the smooth path established by the historical anchor points.
- Anchor Markers: Visual dots placed exactly on the significant highs or lows detected during the scanning phase, allowing you to see the "skeleton" of the price action.
- Future Projection: This is a key feature where the logic extends the calculated curve into the future (based on a user-defined shift). By projecting the mathematical trend forward, it provides a visual estimate of where the current trajectory might lead based on the established historical curve.
Summary for the User
Essentially, this tool acts as a "trend smoother." It ignores the erratic movements of individual candles and instead focuses on the significant peaks and valleys to draw a mathematical arc. By seeing this arc, you can better visualize the primary momentum of the market and see a projected path of where that momentum might head next.
//+------------------------------------------------------------------+
//|                                         		      siLagrange.mq4 |
//|                                 Copyright © 2007 Ñåðãååâ Àëåêñåé |
//|                                              profy.mql@gmail.com |
//+------------------------------------------------------------------+
#property copyright "Copyright © 2007-2011, Ñåðãååâ Àëåêñåé "
#property link      "mailto: profy.mql@gmail.com"
//----
#property indicator_chart_window
#property indicator_buffers 3
#property indicator_color1 SkyBlue
#property indicator_color2 Crimson
#property indicator_color3 Crimson
//----
extern int Pow=3;//Ñòåïåíü ïîëèíîìà Ëàãðàíæà. Æåëàòåëüíî 3..8
extern int Depth=12;//ìèíèìàëüíîå ðàññòîÿíèå ìåæäó îïîðíûìè òî÷êàìè
extern int Mode=MODE_HIGH;//MODE_HIGH, MODE_LOW, MODE_CLOSE
extern int TimeFrame=0;
extern int Shift=10;//Íà ñêîëüêî áàðîâ ïðîäëåâàåì â áóäóùåå
//----
double Lx[];//Ïîëèíîì Ëàãðàíæà
double Lx0[];//Ïîëèíîì Ëàãðàíæà â áóäóùåå íà shift áàðîâ
double Pnt[];//Èíäèêàòîð îïîðíûõ òî÷åê ïîñòðîåíèÿ

int X[];//Íîìåðà áàðîâ ïî êîòîðûì ñòðîèòñÿ ïîëèíîì
double Y[];//Çíà÷åíèÿ öåíû â òî÷êàõ (O, H, L èëè C)
double C[];//Êîýôôèöèåíòû ïîëèíîìà
//-----------------------------------------------------------	Lagrange
int init()
{
//---- indicator line
	SetIndexBuffer(0,Lx); SetIndexStyle(0,DRAW_LINE);
	SetIndexBuffer(1,Lx0); SetIndexStyle(1,DRAW_LINE); SetIndexShift(1, Shift);
	SetIndexBuffer(2,Pnt); SetIndexStyle(2,DRAW_ARROW); SetIndexArrow(2, 159);

	ArrayResize(X, Pow); ArrayResize(Y, Pow); ArrayResize(C, Pow);

	return(0);
}
//-----------------------------------------------------------	Lagrange
int start()
{
	if (Pow<=1) Pow = 2;//ïðîâåðêà êîððåêòíîñòè
	if (Pow>=21) Pow = 20;//ïðîâåðêà êîððåêòíîñòè

	//0. Îïðåäåëÿåì òàáëèöó çíà÷åíèé X è Y äëÿ ïîñòðîåíèÿ ïîëèíîìà
	FindPoint();
	//
	Lagrange();
	//----
	return(0);
}
//-----------------------------------------------------------	FindPoint
void FindPoint()
{
	int pos, pos2, pos_prev = -1;
	if (Depth<=0) Depth=2;
	int i=Depth;
	int n=0;//ñ÷åò÷èê òî÷åê (äî Pow)
	while((i<Bars-Depth) && (n<Pow))
	{
		if (Mode==MODE_HIGH)
		{
			pos = iHighest(NULL,0,MODE_HIGH,2*Depth+1,i-Depth);	pos2 = iHighest(NULL,0,MODE_HIGH,2*Depth+1,pos-Depth);
			if ((pos==pos2)&&(pos!=pos_prev))
			{
				X[n] = pos; Y[n]=High[pos]; n++;
				pos_prev = pos;
			}
		}
		if (Mode==MODE_LOW)
		{
			pos = iLowest(NULL,0,MODE_LOW,2*Depth+1,i-Depth);	pos2 = iLowest(NULL,0,MODE_LOW,2*Depth+1,pos-Depth);
			if ((pos==pos2)&&(pos!=pos_prev))
			{
				X[n] = pos; Y[n]=Low[pos]; n++;
				pos_prev = pos;
			}
		}
		i++;
	}
}
//-----------------------------------------------------------	Lagrange
void Lagrange()
{
	int i, j, b;
	//1. Íàéäåì êîýôôèöèåíòû ïîëèíîìà
	for (i = 0; i<Pow; i++)
	{
		C[i] = 1.0;
		for (j = 0; j<Pow; j++)
			 if (j != i)  C[i] = C[i]*(X[i]-X[j]);
		C[i] = Y[i]/C[i];
	}
	// 2. Òåïåðü ïðîõîäÿ ïî âñåì áàðàì äî ìàñèìàëüíîãî áàðà, óêàçàííîãî â ðàñ÷åòå ïîëèíîìà
	//ðàñ÷èòûâàåì ñàì ïîëèíîì (èíäèêàòîð Lx)
	int bars = X[ArrayMaximum(X)];
	double sx;
	for (b = 0; b<=bars; b++)
	{
		Lx[b] = 0.0; Pnt[b] = 0;
		for (i = 0; i<Pow; i++)
		{
			sx = 1;
			for (j = 0; j<Pow; j++)
				if (j != i)	sx = sx*(b-X[j]);
			Lx[b] = Lx[b]+C[i]*sx;
		}
	}
	//3. Çàïîëíèëè ìàññèâ îïîðíûõ òî÷åê
	for (i = 0; i<Pow; i++) Pnt[X[i]] = Y[i];

	//4. È ñòðîåì èíäèêàòîð Lx0 â áóäóùåå íà Shift
	ArrayInitialize(Lx0, EMPTY_VALUE);
	for (b = -Shift; b<=0; b++)
	{
		Lx0[b+Shift] = 0.0;
		for (i = 0; i<Pow; i++)
		{
			sx = 1;
			for (j = 0; j<Pow; j++)
				if (j != i)	sx = sx*(b-X[j]);
			Lx0[b+Shift] = Lx0[b+Shift]+C[i]*sx;
		}
	}
}
Comments