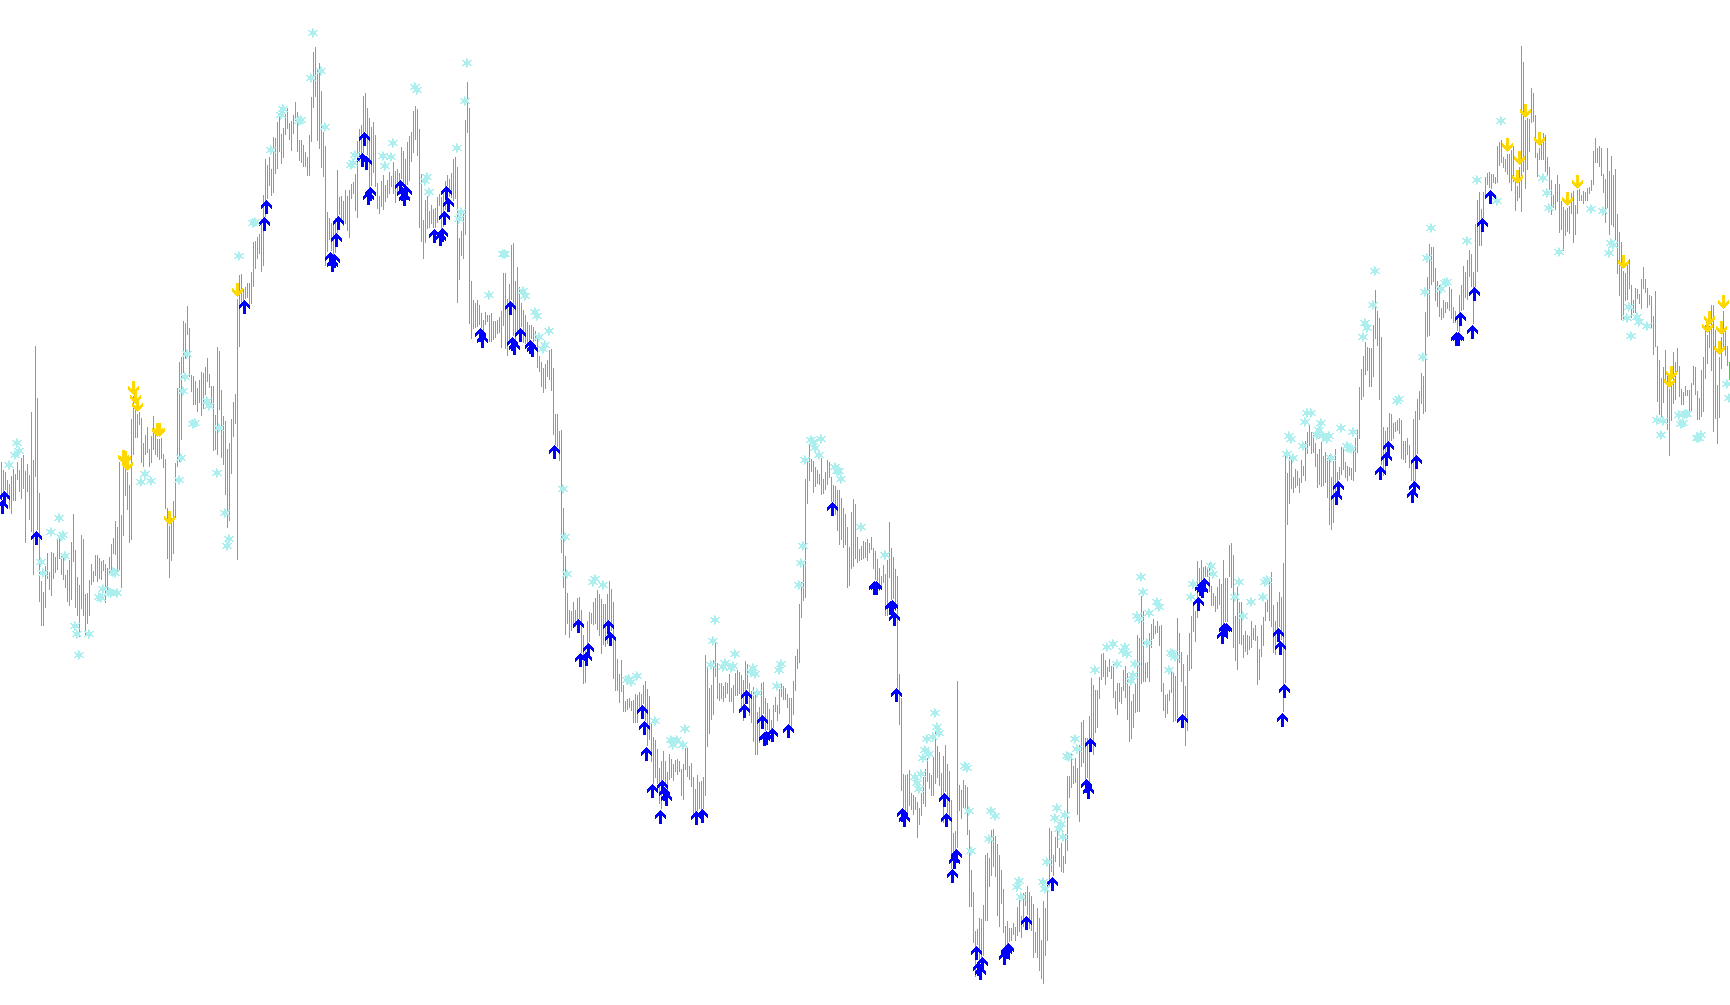
This tool is designed to help traders identify potential entry points and exit signals on a price chart by analyzing long-term trends, momentum, and price action simultaneously. Instead of looking at a single data point, it evaluates three distinct conditions to provide clear visual cues (arrows) on the chart.
Core Logic Overview
The script functions by scanning historical price data and comparing current market movements against three primary layers:
1. The Trend Filter (Moving Average) The system first establishes the "big picture" using a long-term Moving Average (defaulting to 200 periods on a daily basis). This acts as a boundary:
- If the price is below this line, the script primarily looks for opportunities to sell.
- If the price is above this line, it focuses on finding opportunities to buy.
2. Momentum Analysis (RSI) The tool uses a Relative Strength Index (RSI) to measure how fast and in what direction the price is moving. It specifically looks for a "sequence" of momentum over three consecutive days:
- For Selling: It looks for a situation where the momentum is rising consistently across three data points, but stays within specific boundaries.
- For Buying: It looks for a situation where the momentum is falling consistently across three data points, while remaining within its own set of boundaries.
3. Signal Generation (The Arrows) When both the Trend Filter and the Momentum Analysis align, the script places visual markers on your chart:
- Sell Signals: Appear when the price is below the long-term trend and momentum shows a specific upward progression.
- Buy Signals: Appear when the price is above the long-term trend and momentum shows a specific downward progression.
Trade Management (Exit Markers)
Beyond just telling you when to enter, the script includes logic to help identify potential exit points. It monitors "overextended" conditions where the momentum becomes extreme:
- Take Profit/Exit: If the price is in a downtrend but the momentum drops significantly below a set threshold, it flags a marker.
- Take Profit/Exit: Conversely, if the price is in an uptrend but the momentum rises significantly above a set threshold, it flags a different marker.
Summary for the User
In short, this script filters out "market noise" by ensuring you aren't trading against the primary trend. It only provides a Buy signal when the market is healthy and showing specific cooling behavior, and it only provides a Sell signal when the market is bearish and showing specific heating behavior. The additional markers serve as a guide for when a move may be reaching its limit, helping you manage your exits effectively.
//+------------------------------------------------------------------+
//|                                                    R2_Arrows.mq4 |
//|            Copyright © 2006, transport_david , David W Honeywell |
//|                                     hellonwheels.trans@gmail.com |
//+------------------------------------------------------------------+

#property copyright "transport_david , David W Honeywell"
#property link      "hellonwheels.trans@gmail.com"

#property indicator_chart_window
#property indicator_buffers 3
#property indicator_color1 Coral
#property indicator_color2 White
#property indicator_color3 FireBrick

//---- input parameters

extern int Trend_Ma_Periods = 200;
extern int RsiLowLev        =  35;
extern int RsiHiLev         =  65;
extern int RsiPeriods       =   2;
extern int Applied_Price    =   0;
extern int CloseBuyRsiLev   =  75;
extern int CloseSellRsiLev  =  25;

//---- buffers

double ExtMapBuffer0[];
double ExtMapBuffer1[];
double ExtMapBuffer2[];

//+------------------------------------------------------------------+
//| Custom indicator initialization function                         |
//+------------------------------------------------------------------+

int init()
  {
//---- indicators

   IndicatorBuffers(3);

   SetIndexEmptyValue(0,0.0);
   SetIndexStyle(0,DRAW_ARROW);
   SetIndexArrow(0,234);
   SetIndexBuffer(0,ExtMapBuffer0);

   SetIndexEmptyValue(1,0.0);
   SetIndexStyle(1,DRAW_ARROW);
   SetIndexArrow(1,233);
   SetIndexBuffer(1,ExtMapBuffer1);

   SetIndexEmptyValue(2,0.0);
   SetIndexStyle(2,DRAW_ARROW,STYLE_SOLID,1);
   SetIndexArrow(2,172);
   SetIndexBuffer(2,ExtMapBuffer2);

//----
   return(0);
  }

//+------------------------------------------------------------------+
//| Custor indicator deinitialization function                       |
//+------------------------------------------------------------------+

int deinit()
  {
//----

//----
   return(0);
  }

//+------------------------------------------------------------------+
//| Custom indicator iteration function                              |
//+------------------------------------------------------------------+

int start()
  {

//----
   for (int i=Bars-50; i>=0; i--)
      {

      double prevtime;
      if (Time[0]!=prevtime) { RefreshRates(); prevtime=Time[0]; }

      double Trend_Ma = iMA(Symbol(),PERIOD_D1,Trend_Ma_Periods,0,MODE_SMA,Applied_Price,i);

      double Day1 = iRSI(Symbol(),PERIOD_D1,RsiPeriods,Applied_Price,i+3);
      double Day2 = iRSI(Symbol(),PERIOD_D1,RsiPeriods,Applied_Price,i+2);
      double Day3 = iRSI(Symbol(),PERIOD_D1,RsiPeriods,Applied_Price,i+1);

      //- Sell Arrows ---

      if ( (Close[i+1] < Trend_Ma) && (Day1 > RsiLowLev) && (Day2 > Day1) && (Day3 > Day2) )
         ExtMapBuffer0[i]=High[i]+(20*Point);//High arrow Sell

      //- Buy Arrows ---

      if ( (Close[i+1] > Trend_Ma) && (Day1 < RsiHiLev) && (Day2 < Day1) && (Day3 < Day2) )
         ExtMapBuffer1[i]=Low[i]-(20*Point);//Low arrow Buy

      //- Close Trades Marker ---
      if ( (Close[i+1] < Trend_Ma) && (Day3 < CloseSellRsiLev) )
         ExtMapBuffer2[i]=Low[i]-(50*Point);

      if ( (Close[i+1] > Trend_Ma) && (Day3 > CloseBuyRsiLev) )
         ExtMapBuffer2[i]=High[i]+(50*Point);

      }

//----
   return(0);
  }
//+------------------------------------------------------------------+
Comments