RAVI_v3
Download script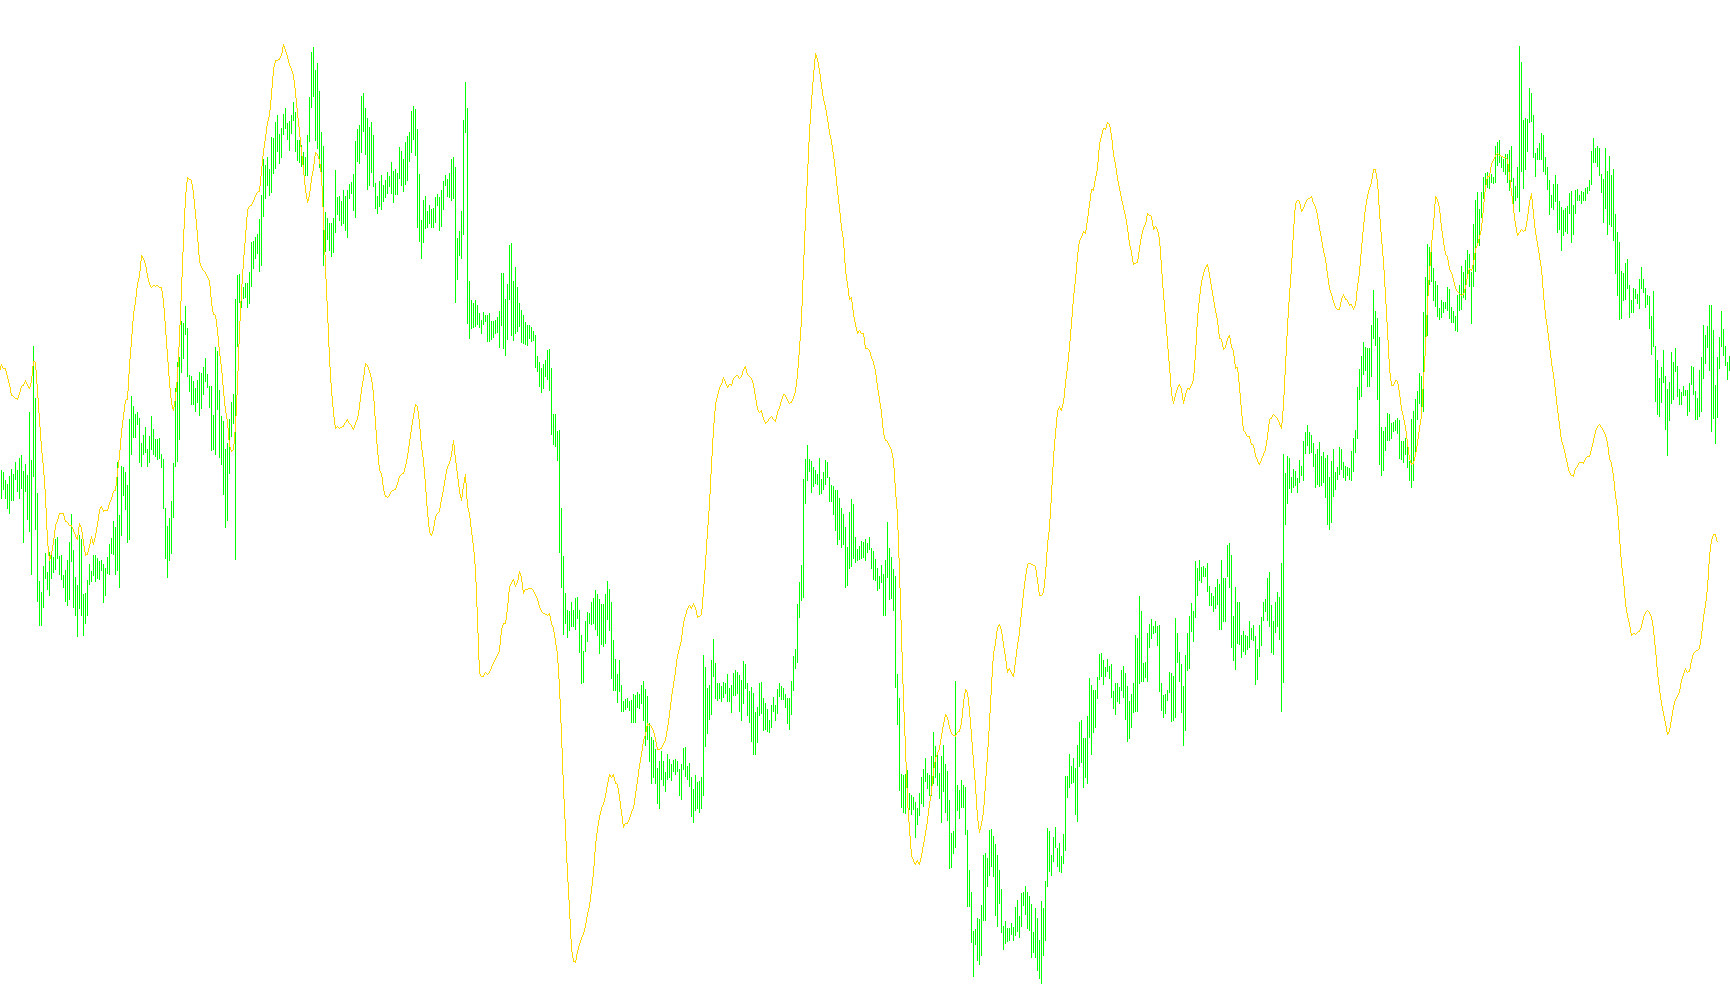
This technical tool is designed to provide traders with a clear visual representation of market momentum by measuring the relative distance between two different moving averages. Instead of looking at raw price action, this script focuses on the "gap" or "spread" between short-term and long-term price trends to help identify how aggressively the market is moving in a specific direction.
How the Logic Works
The script operates by calculating two distinct Simple Moving Averages (SMAs) simultaneously:
- Short-Term Average: This tracks the most recent price fluctuations over a small window of time (defined as Period 1). It reacts quickly to new price changes.
- Long-Term Average: This tracks the broader trend over a much larger window of time (defined as Period 2). It acts as a smoother baseline, representing the overall "path" the market has taken recently.
The Calculation Process
Rather than simply plotting these two lines on your chart, the script performs a specific mathematical comparison between them:
- Comparison: For every moment in time, the tool subtracts the Long-Term Average from the Short-Term Average.
- Percentage Conversion: It then divides that difference by the value of the Long-Term Average and multiplies it by 100.
What This Means for You
The final result is a percentage value displayed in a separate window at the bottom of your trading platform. By looking at this line:
- Positive Values: When the short-term average is significantly higher than the long-term average, the line rises, indicating strong upward momentum (bullish sentiment).
- Negative Values: When the short-term average falls below the long-term average, the line drops, indicating downward momentum (bearish sentiment).
- Trend Strength: The "steepness" of the resulting line tells you how fast the price is pulling away from its average. A very high peak suggests a potentially overextended market, while a flat line suggests the market is moving sideways or consolidating.
Essentially, this tool transforms complex price movements into a single, easy-to-read percentage line that highlights the "velocity" of the current trend.
//+------------------------------------------------------------------+
//|                                                         RAVI.mq4 |
//|                      Copyright © 2005, MetaQuotes Software Corp. |
//|                                        http://www.metaquotes.net |
//+------------------------------------------------------------------+
#property copyright "Copyright © 2005, MetaQuotes Software Corp."
#property link      "http://www.metaquotes.net"
//----
#property indicator_separate_window
#property indicator_buffers 1
#property indicator_color1 Red
//---- indicator parameters
extern int Period1=7;
extern int Period2=65;
//---- buffers
double ExtBuffer[];
//+------------------------------------------------------------------+
//| Custom indicator initialization function                         |
//+------------------------------------------------------------------+
int init()
  {
//---- indicators
   SetIndexStyle(0,DRAW_LINE);
   SetIndexBuffer(0,ExtBuffer);
   IndicatorShortName("RAVI (" + Period1+ ","+Period2+")");
//----
   return(0);
  }
//+------------------------------------------------------------------+
//| Custor indicator deinitialization function                       |
//+------------------------------------------------------------------+
int deinit()
  {
//---- TODO: add your code here
//----
   return(0);
  }
//+------------------------------------------------------------------+
//| Custom indicator iteration function                              |
//+------------------------------------------------------------------+
int start()
  {
   int    counted_bars=IndicatorCounted();
   int i=0;
   double SMA1,SMA2,result;
//---- TODO: add your code here
   for(i=0;i<Bars;i++)
     {
      SMA1=iMA(NULL,0,Period1,0,MODE_SMA,PRICE_CLOSE,i);
      SMA2=iMA(NULL,0,Period2,0,MODE_SMA,PRICE_CLOSE,i);
      result=((SMA1-SMA2)/SMA2)*100;
      ExtBuffer[i]=result;
     }
//----
   return(0);
  }
//+------------------------------------------------------------------+
Comments