RD-ForecastOsc_v2
Download script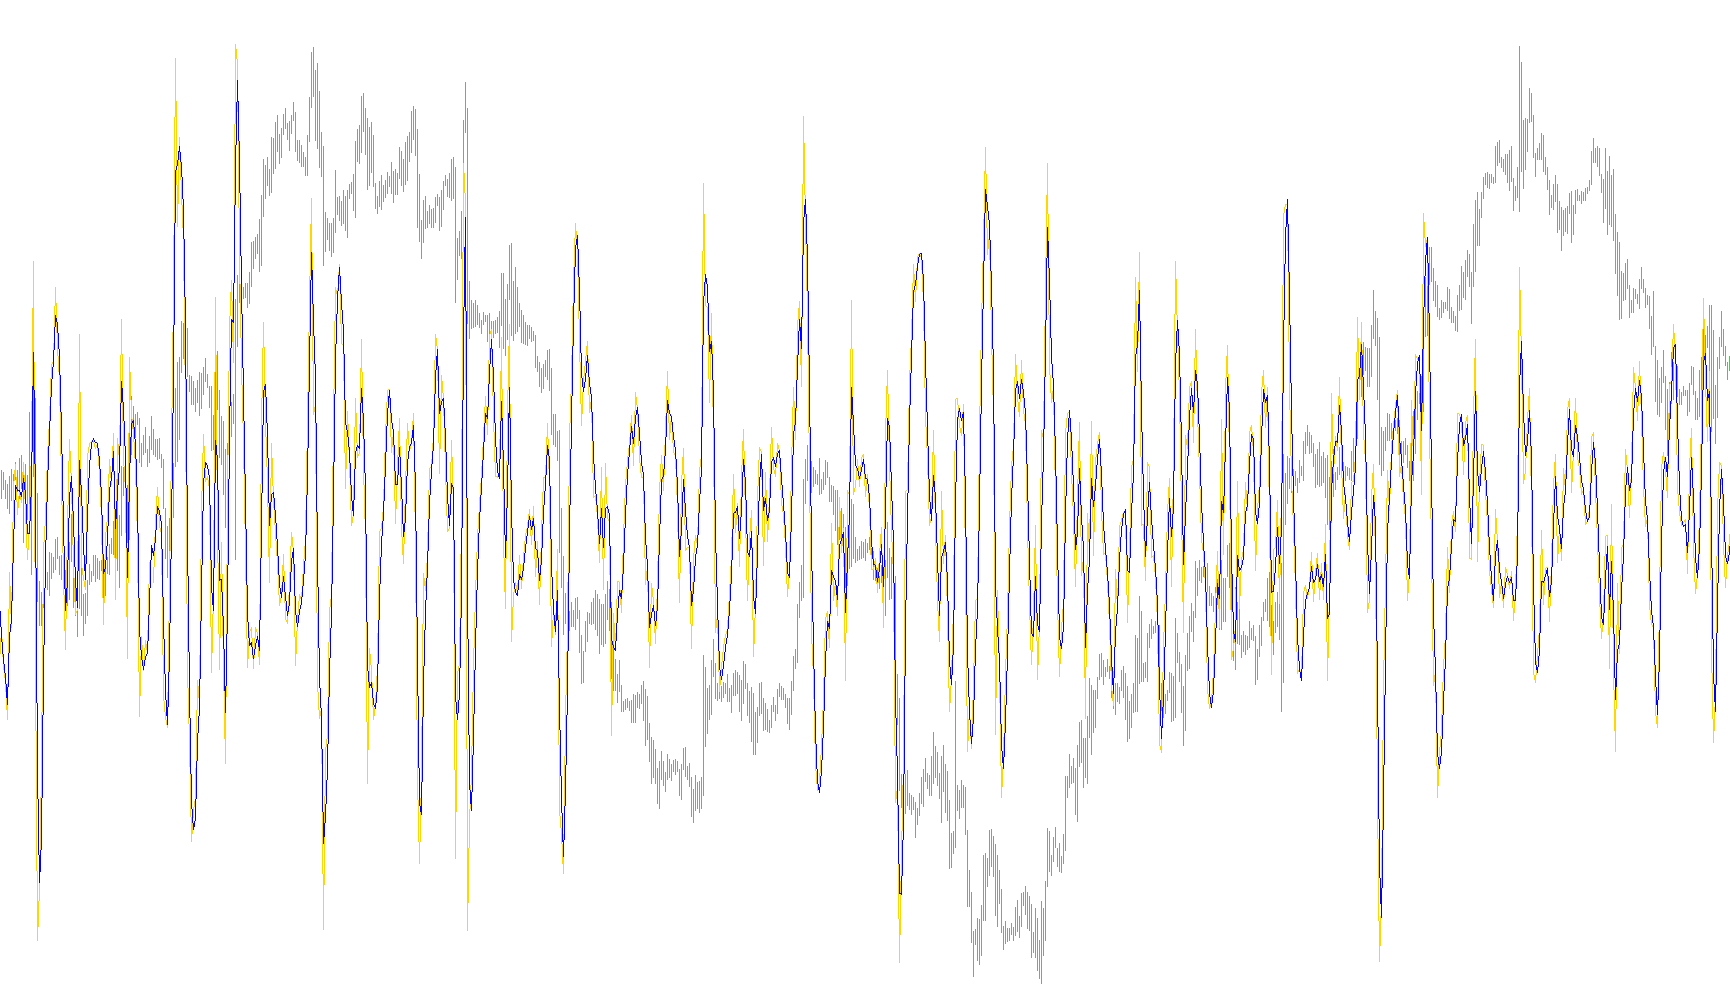
This tool is designed to provide traders with a visual representation of market momentum by calculating and smoothing price trends. It functions as a forecasting oscillator, aiming to highlight the relationship between current price action and historical averages to identify potential market shifts.
Core Logic Overview
The script operates through three primary analytical phases:
1. Weighted Moving Average Calculation Instead of looking at simple price averages, the logic first calculates a specialized weighted sum of previous closing prices. It assigns specific mathematical weights to these historical data points based on a user-defined "Regress" period. This allows the indicator to give more importance to recent price history while still maintaining a broad view of the trend.
2. Forecast Oscillator Generation Once the weighted average is established, the script calculates the "Forecast Oscillator." This represents the percentage difference between the current market price and its calculated moving average. By expressing this as a percentage, the indicator helps traders see how far the price has stretched away from its "normal" mean, which is essential for identifying overbought or oversold conditions.
3. Smoothing and Signal Filtering (T3 Method) To ensure that the oscillator data is clean and readable, the script applies a sophisticated smoothing technique known as a T3 filter. This process takes the raw forecast values and passes them through a series of recursive calculations.
- The goal of this step is to eliminate "noise"—the small, jagged fluctuations in price that can often lead to false signals.
- It produces a smoother trend line (the signal) that follows the momentum of the oscillator but reacts more fluidly, helping users identify the underlying direction of the market more clearly.
Visual Output
The indicator generates two distinct lines on a separate window below the main price chart:
- The Primary Oscillator: This tracks the direct percentage variance of the price from its weighted average.
- The T3 Signal Line: This provides the smoothed interpretation of that variance, making it easier to spot sustained trends and potential reversals without being distracted by temporary market volatility.
/*-----------------------------+
|			       |
| Shared by www.Aptrafx.com    |
|			       |
+------------------------------*/

//+------------------------------------------------------------------+
//|                                                 forecast osc.mq4 |
//|                Copyright © 2005, Nick Bilak, beluck[AT]gmail.com |
//|                                    http://metatrader.50webs.com/ |
//+------------------------------------------------------------------+
#property copyright "Copyright © 2005, Nick Bilak"
#property link      "http://metatrader.50webs.com/"

#property indicator_separate_window

#property indicator_buffers 2
#property indicator_level1 0

#property indicator_color1 SteelBlue
#property indicator_color2 Red


//---- input parameters
       int       Regress= 15;
       int       T3= 3;
       double    B= 0.7;

//---- buffers
double Osc[];
double Osct3[];

double HiSig[];
double LoSig[];


//+------------------------------------------------------------------+
//| Custom indicator initialization function                         |
//+------------------------------------------------------------------+
int init()
{
   SetIndexStyle(0,DRAW_LINE);
   SetIndexBuffer(0,Osc);

   SetIndexEmptyValue(0,0);
   SetIndexStyle(1,DRAW_LINE);
   SetIndexBuffer(1,Osct3);

   return(0);
}

//+------------------------------------------------------------------+
//| Custor indicator deinitialization function                       |
//+------------------------------------------------------------------+
int deinit()
{
   return(0);
}

//+------------------------------------------------------------------+
//| Custom indicator iteration function                              |
//+------------------------------------------------------------------+
int start()
{
   int counted_bars= IndicatorCounted(),
       limit;

   if (counted_bars<0) return(-1);
   if (counted_bars>0) counted_bars--;

   limit= Bars - counted_bars;

   ForecastOsc(0, limit, Osc, Osct3, Regress, T3, B);

   return (0);
}


//+------------------------------------------------------------------+
//| Calc forecast buffers  from lastbar down to offset               |
//+------------------------------------------------------------------+
void ForecastOsc(int offset, int lastbar, double &osc[], double &osct3[], int regress, int t3, double b)
{

   int shift, length;
   double b2,b3,c1,c2,c3,c4,w1,w2,n,WT,
          forecastosc,t3_fosc,sum,
          e1,e2,e3,e4,e5,e6,tmp,tmp2;

   lastbar= MathMin(Bars-31-regress, lastbar);

   for (shift= lastbar+30; shift>=offset; shift--)   {

      b2=b*b;
      b3=b2*b;
      c1=-b3;
      c2=(3*(b2+b3));
      c3=-3*(2*b2+b+b3);
      c4=(1+3*b+b3+3*b2);
      n=t3;

      if (n<1) n=1;
      n = 1 + 0.5*(n-1);
      w1 = 2 / (n + 1);
      w2 = 1 - w1;

      length= regress;
      sum = 0;
      for (int i = length; i>0; i--) {
         tmp = length+1;
         tmp = tmp/3;
         tmp2 = i;
         tmp = tmp2 - tmp;
         sum = sum + tmp*Close[shift+length-i];
      }
      tmp = length;

      WT = sum*6/(tmp*(tmp+1));

      forecastosc= (Close[shift]-WT)/WT*100;

      e1 = w1*forecastosc + w2*e1;
      e2 = w1*e1 + w2*e2;
      e3 = w1*e2 + w2*e3;
      e4 = w1*e3 + w2*e4;
      e5 = w1*e4 + w2*e5;
      e6 = w1*e5 + w2*e6;

      t3_fosc = c1*e6 + c2*e5 + c3*e4 + c4*e3;

      if (shift<=lastbar) {   // don't put swing in cycle into the signal buffers
         osc[shift] = forecastosc;
         osct3[shift] = t3_fosc;
      }

    }

   return(0);
}
Comments