RDI_ForexForecast
Download script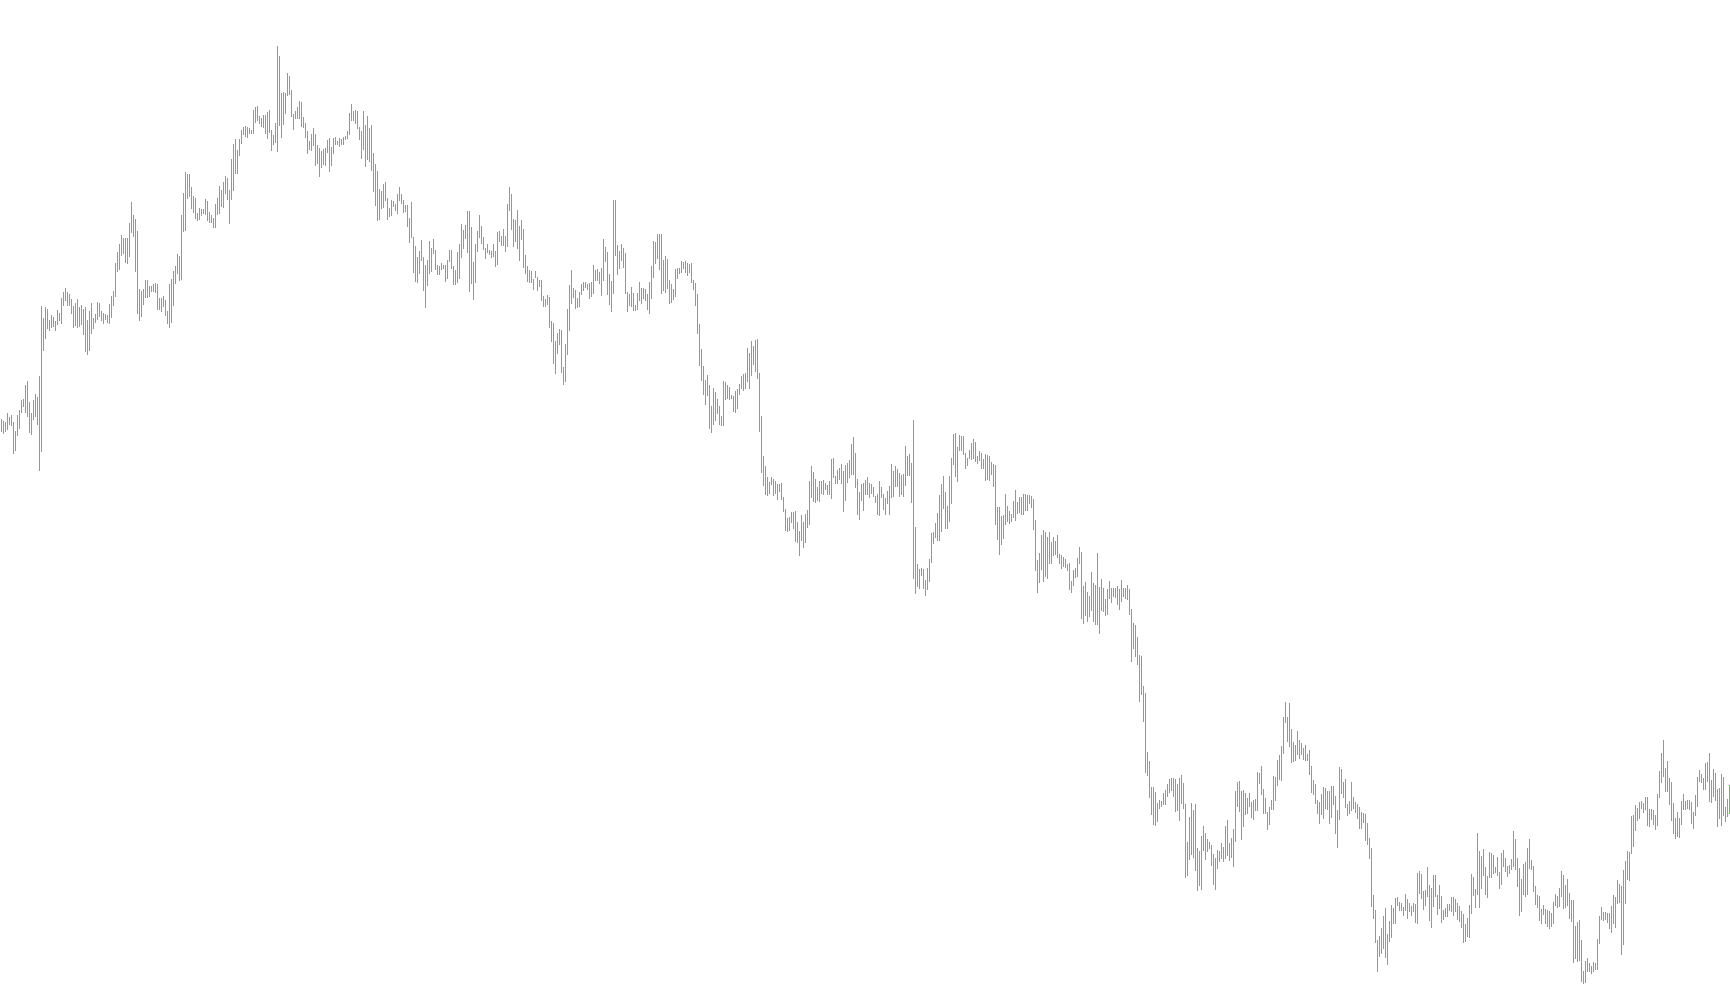
This script functions as a predictive forecasting tool for financial charts. It works by analyzing historical price patterns to identify similarities between past market behavior and current movements, ultimately projecting potential future price points.
How the Logic Works
1. Historical Data Scanning The tool begins by looking at a specific amount of "Base" data (the recent history). It calculates the percentage changes in high and low prices over this period to establish what the current trend looks like.
2. Pattern Matching (Similarity Search) Instead of just looking at the most recent price, the script scans back through a much larger pool of historical data. It searches for "matches"—periods in the past where the price movements were statistically similar to what is happening on the chart right now. It calculates a correlation score to determine how closely these past patterns align with current conditions.
3. Selection of the Best Matches The script identifies a specific number of the "best matches" (the historical periods that look most like today). It prioritizes these high-similarity matches, discarding any historical data that does not reflect the current market environment.
4. Weighted Forecasting Once it has identified the best historical matches, the tool looks at what happened immediately after those patterns occurred in the past. It then calculates a weighted average of those outcomes. This means that if a past pattern was almost identical to today's movement, its "result" carries more weight in the forecast than a pattern that was only vaguely similar.
5. Visual Representation Finally, the script draws visual markers directly on your chart:
- Historical Markers: It plots points showing how it interpreted the "Base" price movements.
- Current Markers: It identifies the current high and low prices.
- Forecast Arrows: It projects a series of arrows into the future (the "Forecast Period"). These represent the predicted path of the market based on the weighted average of the most similar historical occurrences found during its scan.
Summary for the User
In simple terms, this script acts like a "history detective." It looks at what is happening right now, finds the moments in history where the market behaved exactly that way, and then shows you what happened next during those specific times to provide a visual prediction of where the price might go.
//+------------------------------------------------------------------+
//|                                            RDI_ForexForecast.mq4 |
//|                                                              RDI |
//|                                                                  |
//+------------------------------------------------------------------+
#property copyright "RDI"

#property indicator_chart_window

#define MaxBasePeriod 500
#define MaxForecastPeriod 100
#define MaxSamples 10000
#define MaxBaseElements 1000
#define HighPriceColor Red
#define LowPriceColor Green
#define HighPriceStyle 217
#define LowPriceStyle 217


extern int BasePeriod = 280; //Number of basement bars to forecast
extern int ForecastPeriod = 30; //Bars to forecast
extern int Samples = 2000; //Period to check similarity to current movement
extern int BaseElements = 20; //Number of elements to choose for forecasting

//+------------------------------------------------------------------+
//| Custom indicator initialization function                         |
//+------------------------------------------------------------------+
int init()
  {
    return(0);
  }
//+------------------------------------------------------------------+
//| Custom indicator deinitialization function                       |
//+------------------------------------------------------------------+
int deinit()
  {
    int i;
    for(i = 0; i < BasePeriod; i++)
      {
        ObjectDelete(StringConcatenate("HighBase", i));
        ObjectDelete(StringConcatenate("LowBase", i));
      }
    ObjectDelete("HighCurrent");
    ObjectDelete("LowCurrent");
    for(i = 0; i < ForecastPeriod; i++)
      {
        ObjectDelete(StringConcatenate("HighForecast", i));
        ObjectDelete(StringConcatenate("LowForecast", i));
      }

    return(0);
  }
//+------------------------------------------------------------------+
//| Custom indicator iteration function                              |
//+------------------------------------------------------------------+
int start()
  {
    static int last_bars;
    int counted_bars = IndicatorCounted();
    if(counted_bars == 0 || counted_bars != last_bars)
      {
        int i, j, k;

        //Bars to compare with other periods
        double latest_high[MaxBasePeriod], latest_low[MaxBasePeriod];
        for(i = 0; i < BasePeriod; i++)
          {
            latest_high[i] = (High[i + 2] / High[1] - 1) * 1000;
            latest_low[i] = (Low[i + 2] / Low[1] - 1) * 1000;
          }

        double highests[MaxBaseElements][MaxBasePeriod], lowests[MaxBaseElements][MaxBasePeriod], high_forecast[MaxBaseElements][MaxForecastPeriod], low_forecast[MaxBaseElements][MaxForecastPeriod];
        double temporal_high[MaxBasePeriod], temporal_low[MaxBasePeriod], temporal_high_forecast[MaxForecastPeriod], temporal_low_forecast[MaxForecastPeriod];
        double correlation[MaxBaseElements], temporal_correlation;
        ArrayInitialize(correlation, 0.0);

        //Collect [BaseElements] of data
        for(i = 0; i < BaseElements; i++)
          {
            for(j = 0; j < BasePeriod; j++)
              {
                highests[i][j] = (High[ForecastPeriod + 1 + i + j] / High[ForecastPeriod + 1 + i] - 1) * 1000;
                lowests[i][j] = (Low[ForecastPeriod + 1 + i + j] / Low[ForecastPeriod + 1 + i] - 1) * 1000;
                correlation[i] += (MathPow((latest_high[j] - highests[i][j]), 2) + MathPow((latest_low[j] - lowests[i][j]), 2)) / (BasePeriod * 2);
              }
            for(j = 0; j < ForecastPeriod; j++)
              {
                high_forecast[i][j] = (High[ForecastPeriod + i - j] / High[ForecastPeriod + 1 + i] - 1) * 1000;
                low_forecast[i][j] = (Low[ForecastPeriod + i - j] / Low[ForecastPeriod + 1 + i] - 1) * 1000;
              }
          }

        //Cocktail sort
        int top_index = 0, bottom_index = BaseElements - 1;
        int last_swap;
        while(top_index >= 0)
          {
            last_swap = top_index;
            for(i = top_index; i < bottom_index; i++)
              {
                if(correlation[i + 1] < correlation[i])
                  {
                    for(j = 0; j < BasePeriod; j++)
                      {
                        temporal_high[j] = highests[i][j];
                        temporal_low[j] = lowests[i][j];

                        highests[i][j] = highests[i + 1][j];
                        lowests[i][j] = lowests[i + 1][j];

                        highests[i + 1][j] = temporal_high[j];
                        lowests[i + 1][j] = temporal_low[j];
                      }
                    for(j = 0; j < ForecastPeriod; j++)
                      {
                        temporal_high_forecast[j] = high_forecast[i][j];
                        temporal_low_forecast[j] = low_forecast[i][j];

                        high_forecast[i][j] = high_forecast[i + 1][j];
                        low_forecast[i][j] = low_forecast[i + 1][j];

                        high_forecast[i + 1][j] = high_forecast[i][j];
                        low_forecast[i + 1][j] = low_forecast[i][j];
                      }
                    temporal_correlation = correlation[i];
                    correlation[i] = correlation[i + 1];
                    correlation[i + 1] = temporal_correlation;

                    last_swap = i;
                  }
              }
            bottom_index = last_swap;
            if(top_index == bottom_index) break;

            last_swap = bottom_index;
            for(i = bottom_index; i > top_index; i--)
              {
                if(correlation[i] < correlation[i - 1])
                  {
                    for(j = 0; j < BasePeriod; j++)
                      {
                        temporal_high[j] = highests[i][j];
                        temporal_low[j] = lowests[i][j];

                        highests[i][j] = highests[i - 1][j];
                        lowests[i][j] = lowests[i - 1][j];

                        highests[i - 1][j] = temporal_high[j];
                        lowests[i - 1][j] = temporal_low[j];
                      }
                    for(j = 0; j < ForecastPeriod; j++)
                      {
                        temporal_high_forecast[j] = high_forecast[i][j];
                        temporal_low_forecast[j] = low_forecast[i][j];

                        high_forecast[i][j] = high_forecast[i - 1][j];
                        low_forecast[i][j] = low_forecast[i - 1][j];

                        high_forecast[i - 1][j] = high_forecast[i][j];
                        low_forecast[i - 1][j] = low_forecast[i][j];
                      }
                    temporal_correlation = correlation[i];
                    correlation[i] = correlation[i - 1];
                    correlation[i - 1] = correlation[i];

                    last_swap = i;
                  }
              }
            top_index = last_swap;
            if(top_index == bottom_index) break;
          }

        //Calculate other data
        int all_sample = MathMin(Samples, Bars) - ForecastPeriod - BasePeriod;
        for(i = BaseElements; i < all_sample; i++)
          {
            temporal_correlation = 0.0;
            for(j = 0; j < BasePeriod; j++)
              {
                temporal_high[j] = (High[ForecastPeriod + 1 + i + j] / High[ForecastPeriod + 1 + i] - 1) * 1000;
                temporal_low[j] = (Low[ForecastPeriod + 1 + i + j] / Low[ForecastPeriod + 1 + i] - 1) * 1000;
                temporal_correlation += (MathPow((latest_high[j] - temporal_high[j]), 2) + MathPow((latest_low[j] - temporal_low[j]), 2)) / (BasePeriod * 2);
              }

            //Insert data
            if(temporal_correlation < correlation[BaseElements - 1])
              {
                for(j = 0; j < BasePeriod; j++)
                  {
                    highests[BaseElements - 1][j] = temporal_high[j];
                    lowests[BaseElements - 1][j] = temporal_low[j];
                  }
                for(j = 0; j < ForecastPeriod; j++)
                  {
                    high_forecast[BaseElements - 1][j] = (High[ForecastPeriod + i - j] / High[ForecastPeriod + 1 + i] - 1) * 1000;
                    low_forecast[BaseElements - 1][j] = (Low[ForecastPeriod + i - j] / Low[ForecastPeriod + 1 + i] - 1) * 1000;
                  }
                correlation[BaseElements - 1] = temporal_correlation;
                j = BaseElements - 1;
                while(j > 0)
                  {
                    if(correlation[j] < correlation[j-1])
                      {
                        for(k = 0; k < BasePeriod; k++)
                          {
                            temporal_high[k] = highests[j][k];
                            temporal_low[k] = lowests[j][k];

                            highests[j][k] = highests[j - 1][k];
                            lowests[j][k] = lowests[j - 1][k];

                            highests[j - 1][k] = temporal_high[k];
                            lowests[j - 1][k] = temporal_low[k];
                          }

                        for(k = 0; k < ForecastPeriod; k++)
                          {
                            temporal_high_forecast[k] = high_forecast[j][k];
                            temporal_low_forecast[k] = low_forecast[j][k];

                            high_forecast[j][k] = high_forecast[j - 1][k];
                            low_forecast[j][k] = low_forecast[j - 1][k];

                            high_forecast[j - 1][k] = temporal_high_forecast[k];
                            low_forecast[j - 1][k] = temporal_low_forecast[k];
                          }

                        temporal_correlation = correlation[j];
                        correlation[j] = correlation[j - 1];
                        correlation[j - 1] = temporal_correlation;

                        j--;
                      }
                    else break;
                  }
              }
          }

        //Calculate forecast bars
        double highests_result[MaxBasePeriod], lowests_result[MaxBasePeriod], high_forecast_result[MaxForecastPeriod], low_forecast_result[MaxForecastPeriod];
        ArrayInitialize(highests_result, 0.0);
        ArrayInitialize(lowests_result, 0.0);
        ArrayInitialize(high_forecast_result, 0.0);
        ArrayInitialize(low_forecast_result, 0.0);

        temporal_correlation = 0.0;
        for(i = 0; i < BaseElements; i++) temporal_correlation += 1 / correlation[i];
        for(j = 0; j < BasePeriod; j++)
          {
            for(i = 0; i < BaseElements; i++)
              {
                highests_result[j] += (1 / correlation[i]) * highests[i][j];
                lowests_result[j] += (1 / correlation[i]) * lowests[i][j];
              }
            highests_result[j] /= temporal_correlation;
            lowests_result[j] /= temporal_correlation;
          }
        for(j = 0; j< ForecastPeriod; j++)
          {
            for(i = 0; i < BaseElements; i++)
              {
                high_forecast_result[j] += (1 / correlation[i]) * high_forecast[i][j];
                low_forecast_result[j] += (1 / correlation[i]) * low_forecast[i][j];
              }
            high_forecast_result[j] /= temporal_correlation;
            low_forecast_result[j] /= temporal_correlation;
          }

        //Draw arrows
        for(i = 0; i < BasePeriod; i++)
          {
            ObjectDelete(StringConcatenate("HighBase", i));
            ObjectCreate(StringConcatenate("HighBase", i), OBJ_ARROW, 0, Time[i + 2], High[1] + High[1] * highests_result[i] / 1000);
               ObjectSet(StringConcatenate("HighBase", i), OBJPROP_COLOR, HighPriceColor);
               ObjectSet(StringConcatenate("HighBase", i), OBJPROP_ARROWCODE, HighPriceStyle);
            ObjectDelete(StringConcatenate("LowBase", i));
            ObjectCreate(StringConcatenate("LowBase", i), OBJ_ARROW, 0, Time[i + 2], Low[1] + Low[1] * lowests_result[i] / 1000);
               ObjectSet(StringConcatenate("LowBase", i), OBJPROP_COLOR, LowPriceColor);
               ObjectSet(StringConcatenate("LowBase", i), OBJPROP_ARROWCODE, LowPriceStyle);
          }
        ObjectDelete("HighCurrent");
        ObjectCreate("HighCurrent", OBJ_ARROW, 0, Time[1], High[1]);
           ObjectSet("HighCurrent", OBJPROP_COLOR, HighPriceColor);
           ObjectSet("HighCurrent", OBJPROP_ARROWCODE, HighPriceStyle);
        ObjectDelete("LowCurrent");
        ObjectCreate("LowCurrent", OBJ_ARROW, 0, Time[1], Low[1]);
           ObjectSet("LowCurrent", OBJPROP_COLOR, LowPriceColor);
           ObjectSet("LowCurrent", OBJPROP_ARROWCODE, LowPriceStyle);
        for(i = 0; i < ForecastPeriod; i++)
          {
            ObjectDelete(StringConcatenate("HighForecast", i));
            ObjectCreate(StringConcatenate("HighForecast", i), OBJ_ARROW, 0, Time[0] + (Time[0] - Time[1]) * i, High[1] + High[1] * high_forecast_result[i] / 1000);
               ObjectSet(StringConcatenate("HighForecast", i), OBJPROP_COLOR, HighPriceColor);
               ObjectSet(StringConcatenate("HighForecast", i), OBJPROP_ARROWCODE, HighPriceStyle);
            ObjectDelete(StringConcatenate("LowForecast", i));
            ObjectCreate(StringConcatenate("LowForecast", i), OBJ_ARROW, 0, Time[0] + (Time[0] - Time[1]) * i, Low[1] + Low[1] * low_forecast_result[i] / 1000);
               ObjectSet(StringConcatenate("LowForecast", i), OBJPROP_COLOR, LowPriceColor);
               ObjectSet(StringConcatenate("LowForecast", i), OBJPROP_ARROWCODE, LowPriceStyle);
          }
      }

    return(0);
  }
//+------------------------------------------------------------------+
Comments