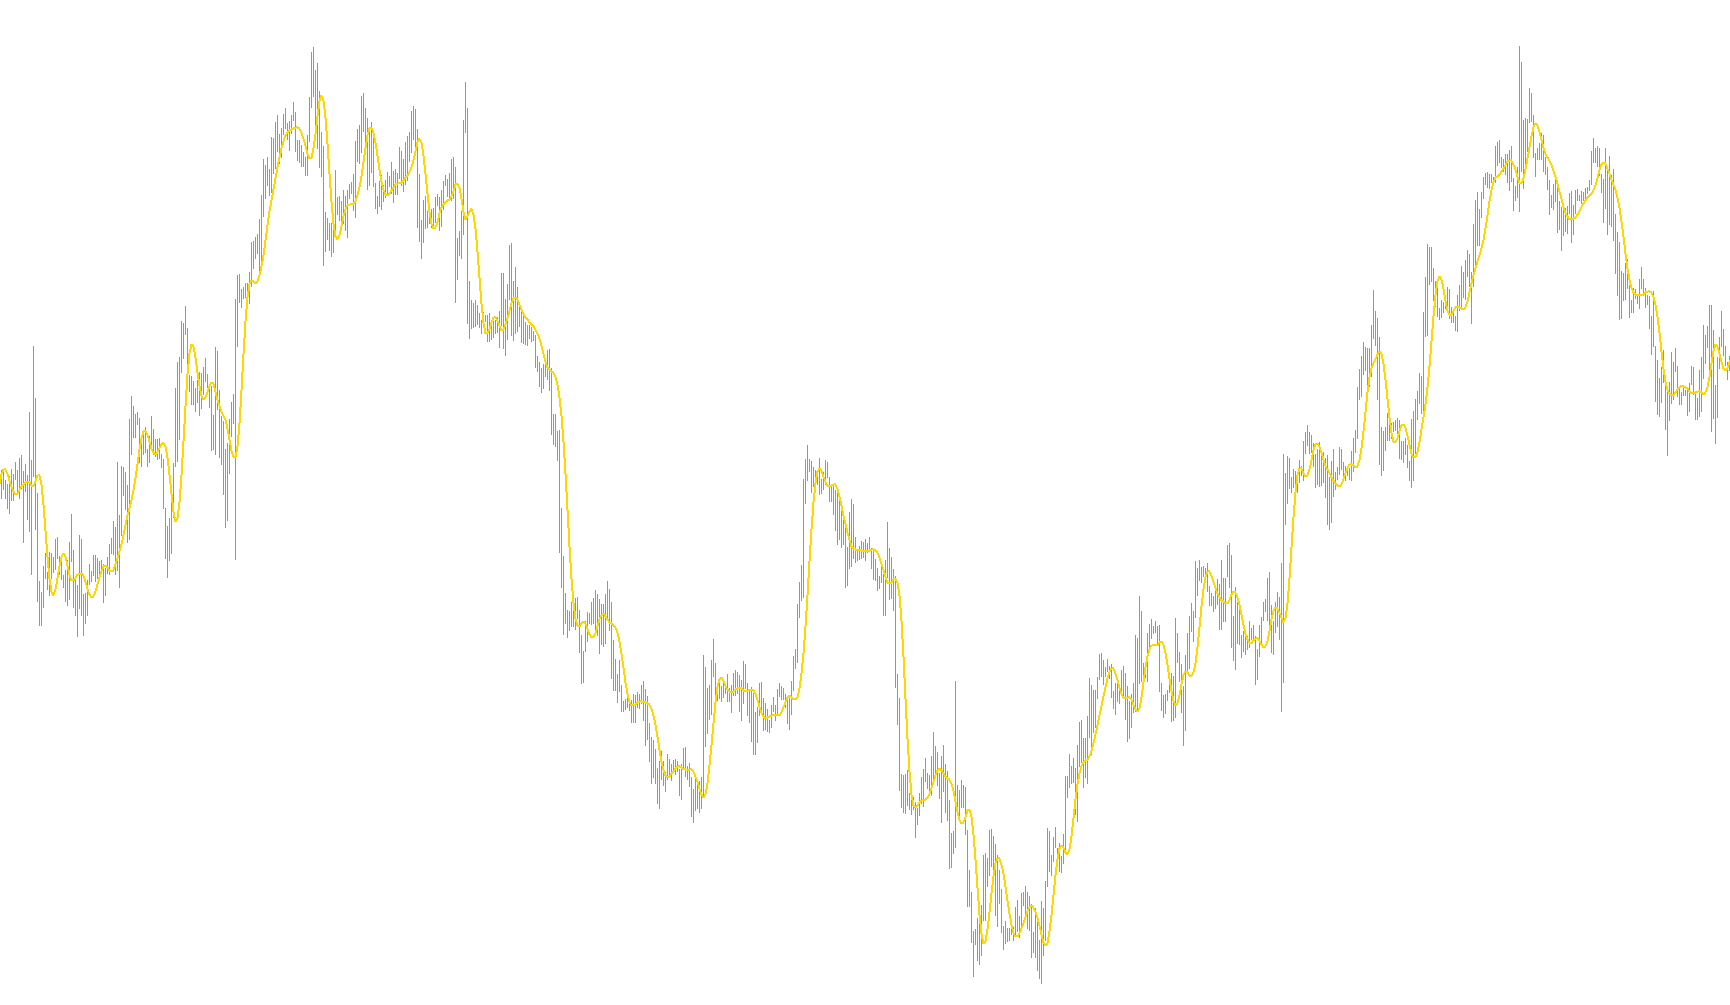
This technical tool is designed to analyze market price action by calculating a specific weighted average of historical data. Rather than simply looking at the most recent price, the script evaluates a sequence of 44 previous closing prices to determine a smoothed trend line on your trading chart.
How the Logic Works
1. Weighted Data Processing The core of this tool lies in its "coefficient" system. Each of the 44 historical periods is assigned a specific numerical weight (a coefficient). These weights are not equal; some periods have a high positive influence, others a negative influence, and some are nearly neutral. By multiplying each price by its corresponding weight, the script determines exactly how much importance to give to that specific point in time.
2. Trend Calculation To arrive at the final value shown on your chart, the script performs a rolling calculation:
- It looks back at the last 44 candles.
- It applies the unique weight to each candle's closing price.
- It sums all these weighted values together to produce a single data point.
3. Visual Representation The result of this calculation is plotted as a continuous red line on your main trading window. Because it uses 44 periods of data, the resulting line acts as a smoothed indicator of market momentum. It filters out minor "noise" in the price movement to help highlight the underlying direction of the market.
Summary for the Trader
Think of this script as a sophisticated "weighted filter." Instead of reacting instantly to every tiny price tick, it looks at a window of 44 previous prices and blends them together based on a pre-defined mathematical formula. This helps identify the broader trend by balancing out short-term fluctuations with historical context.
//+------------------------------------------------------------------+
//|                                                         RFTL.mq4 |
//|                            Copyright 2005, Gordago Software Ltd. |
//|                                          http://www.gordago.com/ |
//+------------------------------------------------------------------+
#property copyright "Copyright 2005, Gordago Software Ltd."
#property link      "http://www.gordago.com"
//----
#property indicator_chart_window
#property indicator_buffers 1
#property indicator_color1 Red
//----
double RFTLBuffer[];
#define RFTLPeriods 44
double g_RFTLKoef[RFTLPeriods]=
 {-0.0025097319, +0.0513007762 , +0.1142800493 , +0.1699342860 , +0.2025269304 ,
  +0.2025269304, +0.1699342860 , +0.1142800493 , +0.0513007762 , -0.0025097319 ,
  -0.0353166244, -0.0433375629 , -0.0311244617 , -0.0088618137 , +0.0120580088 ,
  +0.0233183633, +0.0221931304 , +0.0115769653 , -0.0022157966 , -0.0126536111 ,
  -0.0157416029, -0.0113395830 , -0.0025905610 , +0.0059521459 , +0.0105212252 ,
  +0.0096970755, +0.0046585685 , -0.0017079230 , -0.0063513565 , -0.0074539350 ,
  -0.0050439973, -0.0007459678 , +0.0032271474 , +0.0051357867 , +0.0044454862 ,
  +0.0018784961, -0.0011065767 , -0.0031162862 , -0.0033443253 , -0.0022163335 ,
   +0.0002573669, +0.0003650790 , +0.0060440751 , +0.0018747783 };
//+------------------------------------------------------------------+
//|                                                                  |
//+------------------------------------------------------------------+
int init()
  {
   IndicatorBuffers(1);
   SetIndexStyle(0,DRAW_LINE,STYLE_SOLID,2);
   SetIndexBuffer(0, RFTLBuffer);
   SetIndexDrawBegin(0,44);
//----
   return(0);
  }
//+------------------------------------------------------------------+
//|                                                                  |
//+------------------------------------------------------------------+
int deinit()
  {
   return(0);
  }
//+------------------------------------------------------------------+
//|                                                                  |
//+------------------------------------------------------------------+
int start()
  {
   int    counted_bars=IndicatorCounted();
   int    j,pos;
   double sum2;
   if(counted_bars<0)  return(-1);
   for(pos=Bars-counted_bars-1;pos>=0;pos--)
     {
      sum2=0;          // zero summary
      for(j=0;j<RFTLPeriods;j++) sum2+=g_RFTLKoef[j]*Close[pos+j];//Counted RFTL[pos]
      RFTLBuffer[pos]=sum2;
     }
   return(0);
  }
//+------------------------------------------------------------------+
Comments