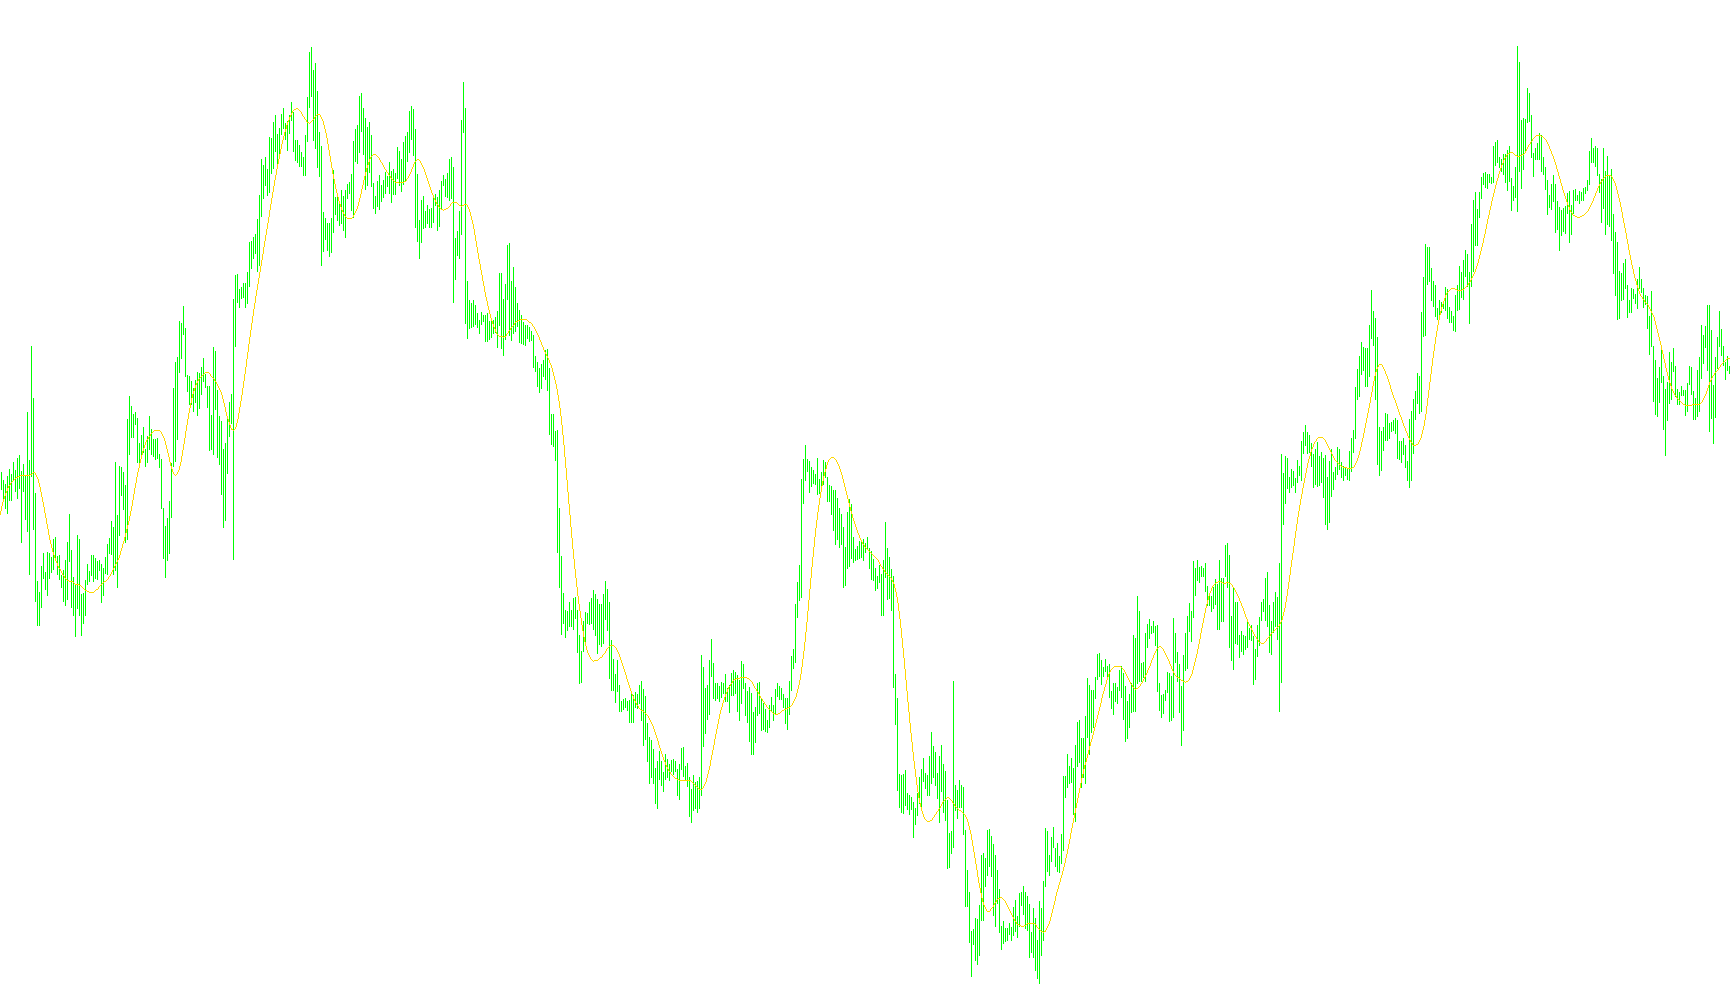
This script is a specialized technical analysis tool designed to smooth out market price fluctuations, helping traders identify underlying trends more clearly by filtering out "noise." It operates by processing historical price data to create a continuous visual line on your trading chart.
How the Logic Works
The core logic of this indicator relies on a multi-layered smoothing process. Instead of looking at just the most recent price or a simple average, it treats the market data as a moving stream that undergoes several mathematical transformations:
1. Weighted Data Integration
The tool begins by assigning specific weights to different price points based on a user-defined period (the t3_period). It uses a weighting system that ensures that while recent prices are important, they are balanced against historical context to prevent the indicator from reacting too aggressively to sudden, minor price spikes.
2. Sequential Smoothing Layers The script performs a series of internal calculations where each result is fed into the next step. Think of this as passing the market data through several different filters in a row. Each "filter" takes the smoothed output of the previous one and refines it further. By doing this multiple times, the indicator achieves a much smoother curve than standard moving averages.
3. The Final Trend Calculation
After the price data has been passed through these layers of smoothing, the tool applies a final set of coefficients (based on the b parameter). This step calculates the specific "trend" value that is eventually drawn on your screen. Because of this heavy smoothing, the resulting line represents a stabilized view of the market direction.
Key Takeaways for the User
- Trend Identification: The primary goal of this logic is to help you see where the market is "headed" by stripping away the erratic movements of minute-to-minute trading.
- Customizable Sensitivity: You can adjust how much data the tool looks at (
t3_period) and how aggressively it smooths the line (b).- A larger period will result in a slower, more stable line that ignores minor fluctuations.
- The
bvalue acts as a fine-tuning knob for the mathematical curve of the smoothing.
- Visual Output: The final result is a clean, gold-colored line plotted directly on your chart, providing a clear visual path of the price movement over time.
//+------------------------------------------------------------------+
//|                                                        SmCCI.mq4 |
//|                      Copyright © 2006, MetaQuotes Software Corp. |
//|                                        http://www.metaquotes.net |
//+------------------------------------------------------------------+
#property copyright "Copyright © 2006, MetaQuotes Software Corp."
#property link      "http://www.metaquotes.net"

#property indicator_chart_window
#property indicator_buffers 1
#property indicator_color1 Gold

//---- input parameters


extern int t3_period=21;
extern double b=0.7;


//---- buffers
double ExtMapBuffer1[];

//+------------------------------------------------------------------+
//| Custom indicator initialization function                         |
//+------------------------------------------------------------------+
int init()
  {
//---- indicators
   SetIndexStyle(0,DRAW_LINE);
   SetIndexBuffer(0,ExtMapBuffer1);
//----
   return(0);
  }
//+------------------------------------------------------------------+
//| Custom indicator iteration function                              |
//+------------------------------------------------------------------+
int start()
  {
   double e1, e2, e3, e4, e5, e6, c1, c2, c3, c4, n, w1, w2, b2, b3;
   double dpo, t3;

   b2=b*b;
   b3=b2*b;
   c1=-b3;
   c2=(3*(b2+b3));
   c3=-3*(2*b2+b+b3);
   c4=(1+3*b+b3+3*b2);
   n=t3_period;

   if (n<1) n=1;
   n = 1 + 0.5*(n-1);
   w1 = 2 / (n + 1);
   w2 = 1 - w1;


   for(int i=Bars; i>=0; i--)

   {

      dpo=Close[i];

      e1 = w1*dpo + w2*e1;
      e2 = w1*e1 + w2*e2;
      e3 = w1*e2 + w2*e3;
      e4 = w1*e3 + w2*e4;
      e5 = w1*e4 + w2*e5;
      e6 = w1*e5 + w2*e6;

      t3 = c1*e6 + c2*e5 + c3*e4 + c4*e3;
      ExtMapBuffer1[i]=t3;
   }

   return(0);
  }
//+------------------------------------------------------------------+
Comments