Rsi_Bands_B2
Download script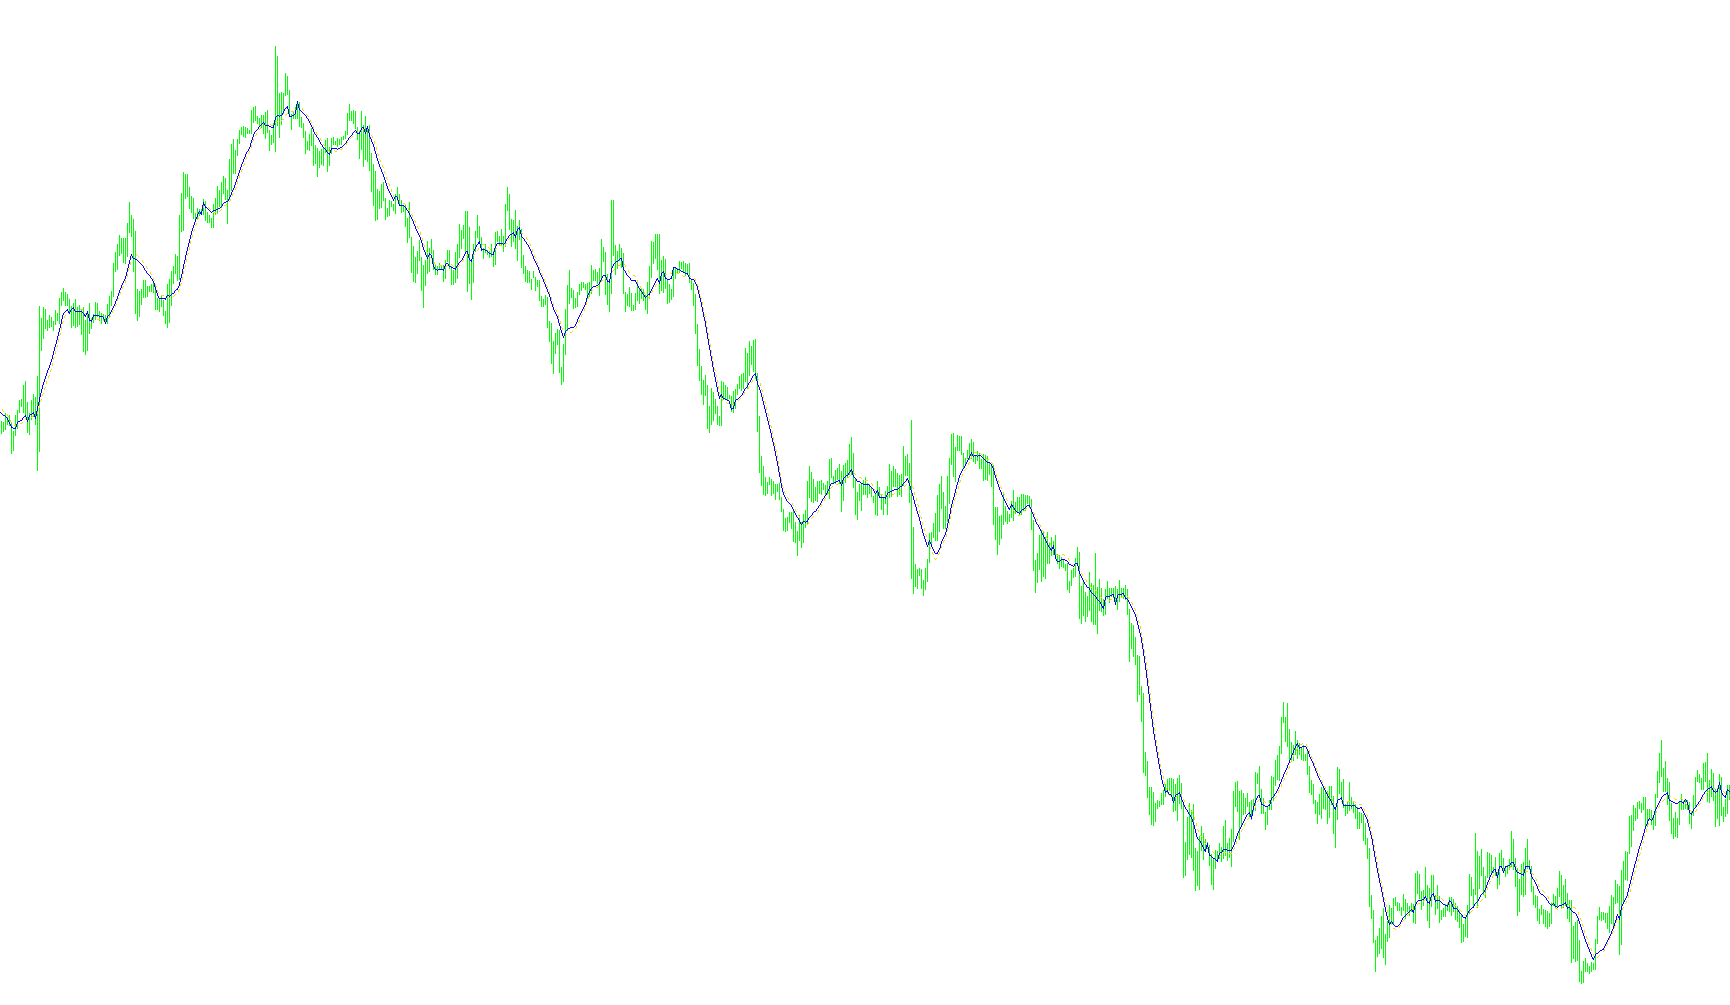
This technical indicator is designed to help traders visualize market momentum and price direction by combining three distinct financial concepts into a single visual layout on the chart. Instead of relying on just one type of data, it blends moving averages, volatility measurements, and relative strength.
Core Components
The logic operates by calculating three primary elements:
- A Baseline (Moving Average): The script calculates a custom average price based on the high, low, and closing prices over a specific timeframe. This serves as the "anchor" or equilibrium point for the indicator.
- Relative Strength (RSI): It measures the speed and change of price movements to determine if an asset is being bought or sold aggressively.
- Market Volatility (ATR): The script looks at how much the price typically "swings" or fluctuates. This ensures that the indicator adjusts its proportions based on whether the market is calm or highly volatile.
How the Logic Works
The indicator identifies the current "mood" of the market to decide how to plot the final line. It follows a specific set of rules:
- Bullish Sentiment: When the price is consistently trading above the baseline (the Moving Average), the script calculates an upper boundary. It takes the baseline and adds a value derived from the Relative Strength index, multiplied by the current market volatility. This creates an "expansion" line above the price to show potential upward momentum.
- Bearish Sentiment: Conversely, when the price is trading below the baseline, the script calculates a lower boundary. It subtracts a value based on the opposite side of the Relative Strength index (the "missing" strength) multiplied by volatility. This creates a downward "expansion" line to visualize selling pressure.
- Neutral State: If the price is hovering directly around the baseline and doesn't show a clear trend, the indicator simply sits on the moving average, signaling a period of consolidation or indecision.
Summary for the User
Essentially, this tool creates dynamic "bands" that move with the price. Rather than being static lines, these bands stretch and shrink automatically based on how fast the market is moving (RSI) and how much it is swinging (Volatility). It helps traders see not just where the price is, but how strongly it is trying to move in a specific direction relative to its recent average.
/*------------------------------------------------------------------+
 |                                                 Rsi_Bands_B2.mq4 |
 |                                                 Copyright © 2010 |
 |                                             basisforex@gmail.com |
 +------------------------------------------------------------------*/
#property copyright "Copyright © 2010, basisforex@gmail.com"
#property link      "basisforex@gmail.com"
//-----
#property indicator_chart_window
#property indicator_buffers  2
#property indicator_color1   Blue
#property indicator_color2   Yellow
//-----
extern    int       nPeriod     = 13;
extern    int       RossiKoeff  = 300;// find value by testing
extern    int       MaShift     = 0;
//-----
double    Deviation, r;
double    MaBuffer[];
double    RSIBuffer[];
//+------------------------------------------------------------------+
int init()
 {
   SetIndexShift(0, MaShift);
   SetIndexShift(1, MaShift);
   //-----
   SetIndexBuffer(0, MaBuffer);
   SetIndexBuffer(1, RSIBuffer);
   //-----
   SetIndexStyle(0, DRAW_LINE, STYLE_DOT);
   SetIndexStyle(1, DRAW_LINE);
   //-----
   SetIndexLabel(0, "MA");
   SetIndexLabel(1, "RSI");
   //-----
   return(0);
 }
//+------------------------------------------------------------------+
int start()
 {
   int limit;
   double a;
   int counted_bars = IndicatorCounted();
   if(counted_bars < 0) return(-1);
   if(counted_bars > 0) counted_bars--;
   limit = Bars - counted_bars;
   for(int i = 0; i < limit; i++)
    {
      a = 0;
      for(int j = 0; j < nPeriod; j++)
       {
         a = a + (iHigh(NULL, 0, i + j) + iLow(NULL, 0, i + j) + iClose(NULL, 0, i + j) * 2) / 4;
       }
      MaBuffer[i]  =  a / nPeriod;
      //-----
      r = iRSI(NULL, 0, nPeriod, PRICE_WEIGHTED, i);
      Deviation = iATR(NULL, 0, nPeriod, i) * RossiKoeff;
      //-----
      if(iHigh(NULL, 0, i) > MaBuffer[i] && iClose(NULL, 0, i) > MaBuffer[i])
       {
         RSIBuffer[i] = MaBuffer[i] + r * Point * Deviation;
       }
      else if(iLow(NULL, 0, i) < MaBuffer[i] && iClose(NULL, 0, i) < MaBuffer[i])
       {
         RSIBuffer[i] = MaBuffer[i] - (100 - r) * Point * Deviation;
       }
      else
       {
         RSIBuffer[i] = MaBuffer[i];
       }
    }
   //-----
   return(0);
 }
//+------------------------------------------------------------------+

/*      switch (Period())
       {
         case 1:
            Deviation = 0.236;
            break;
         case 5:
            Deviation = 0.5;
            break;
         case 15:
            Deviation = 0.764;
            break;
         case 30:
            Deviation = 1;
            break;
         case 60:
            Deviation = 1.618;
            break;
         case 240:
            Deviation = 2.618;
            break;
         case 1440:
            Deviation = 4.618;
            break;
         case 10080:
            Deviation = 10.618;
            break;
         case 43200:
            Deviation = 25.618;
            break;
       }
*/
Comments