RSI Candles
Download script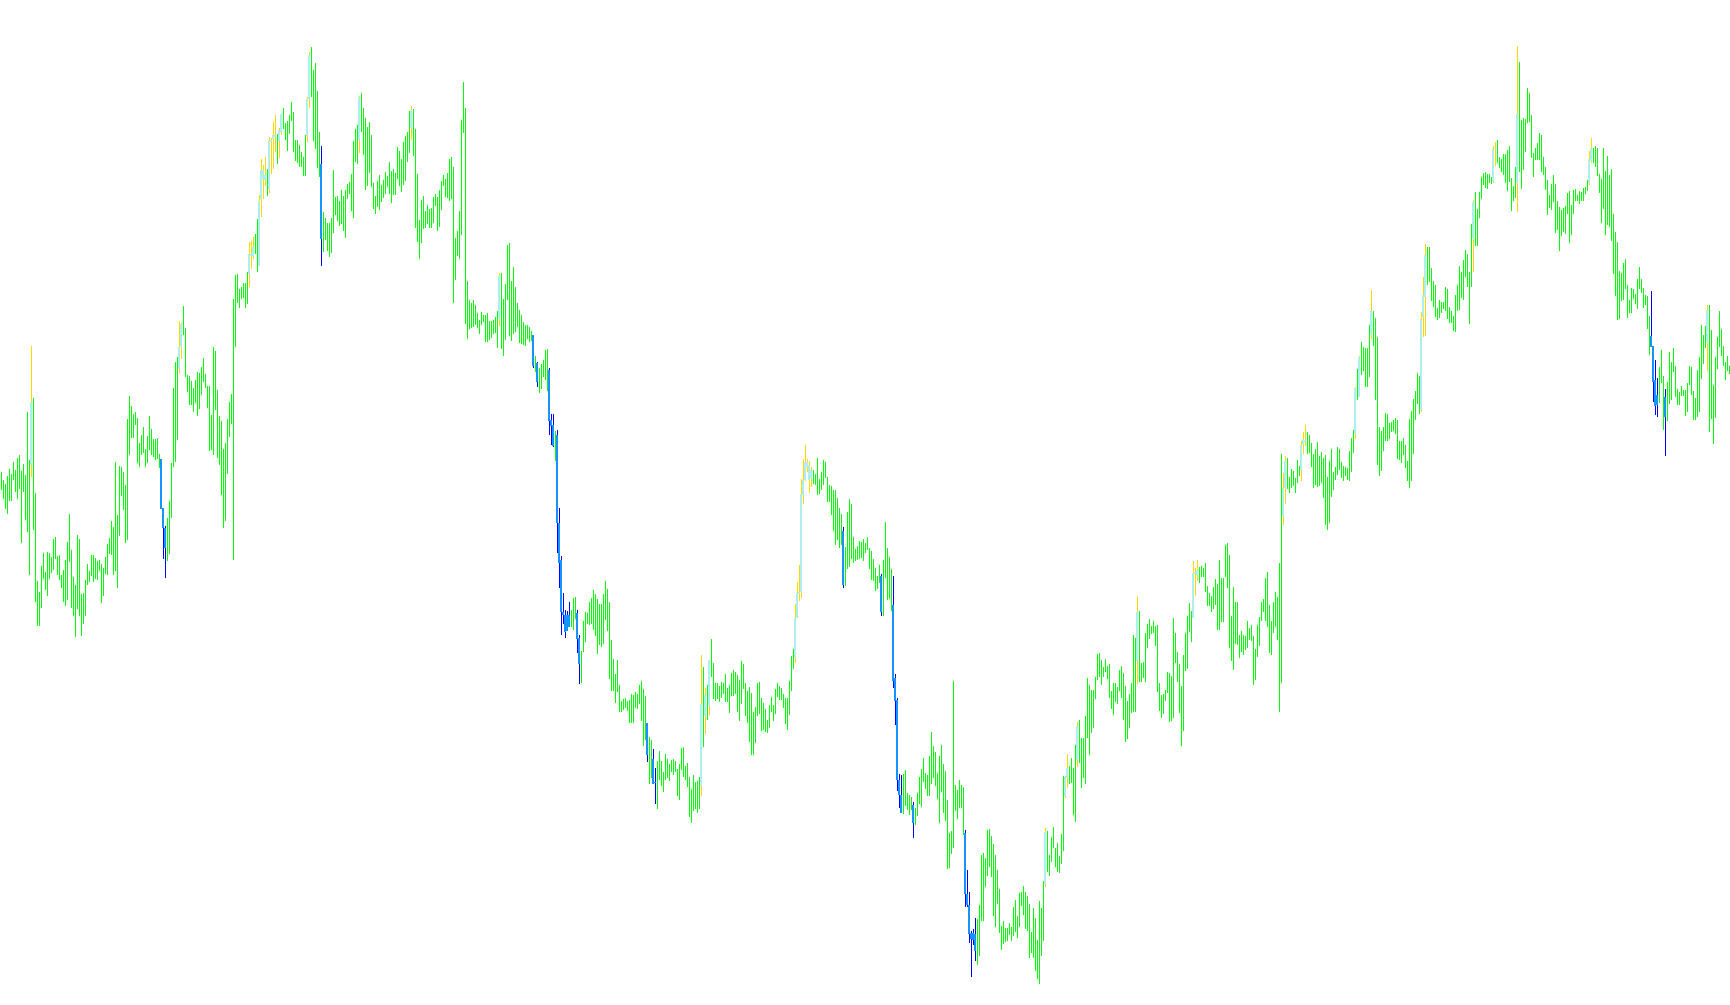
This tool is designed to enhance your trading chart by providing a clear, visual representation of momentum shifts using the Relative Strength Index (RSI). Instead of relying solely on standard line charts or complex oscillators, this script translates market momentum directly onto your price candles to help identify potential overextended conditions at a glance.
How the Logic Works
The script constantly monitors the RSI values based on periods you define. It looks for specific "thresholds" that indicate when a market trend might be reaching an extreme point:
- Overbought Conditions: When the momentum pushes above your designated upper limit (e.g., 80), the script identifies the price action as potentially overextended.
- Oversold Conditions: When the momentum falls below your designated lower limit (e.g., 20), the script identifies the market as potentially undervalued or exhausted.
Visual Representation
To make this information easily digestible, the script applies a color-coded highlighting system to the price bars on your chart:
- Dynamic Coloring: The script distinguishes between different momentum states by changing the colors of the candle wicks and bodies.
- Visual Cues: By utilizing specific green and red highlights, the tool allows you to see exactly where the market has crossed into "Overbought" or "Oversold" territory without needing to toggle between different windows or indicators.
Key Benefits for Your Trading
By integrating this logic directly into your main price view, the script helps streamline your analysis. It serves as a visual filter, allowing you to quickly spot areas where price movement might be losing steam or becoming over-extended, helping you stay aligned with your trading strategy without cluttering your workspace.
//+------------------------------------------------------------------+
//|                                                  RSI Candles.mq4 |
//|                                                                  |
//+------------------------------------------------------------------+
#property copyright "Copyright © 2007, Christof Risch (iya)"
#property link      "http://www.forexfactory.com/showthread.php?t=13321"
#property indicator_chart_window
#property indicator_buffers 4
#property indicator_color1 Green//wick
#property indicator_color2 Red//wick
#property indicator_color3 Green//candle
#property indicator_color4 Red//candle
#property indicator_width1 1
#property indicator_width2 1
#property indicator_width3 3
#property indicator_width4 3


//---- stoch settings
extern int	RSI_Period		= 5;
extern int  RSI_Price      = 0;
extern int	Overbought		= 80;
extern int	Oversold			= 20;

//---- input parameters
extern int	BarWidth			= 1,
				CandleWidth		= 3;

//---- buffers
double Bar1[],
		 Bar2[],
		 Candle1[],
		 Candle2[];


//+------------------------------------------------------------------+
//| Custom indicator initialization function                         |
//+------------------------------------------------------------------+
int init()
{
//---- indicators
	IndicatorShortName("RSI Candles:("+	RSI_Period+")");
	IndicatorBuffers(4);
	SetIndexBuffer(0,Bar1);
	SetIndexBuffer(1,Bar2);
	SetIndexBuffer(2,Candle1);
	SetIndexBuffer(3,Candle2);
	SetIndexStyle(0,DRAW_HISTOGRAM,0,BarWidth);
	SetIndexStyle(1,DRAW_HISTOGRAM,0,BarWidth);
	SetIndexStyle(2,DRAW_HISTOGRAM,0,CandleWidth);
	SetIndexStyle(3,DRAW_HISTOGRAM,0,CandleWidth);

	return(0);
}

//+------------------------------------------------------------------+
double RSI  	(int i = 0)	{return(iRSI(NULL,0,RSI_Period,RSI_Price,i));}


//+------------------------------------------------------------------+
void SetCandleColor(int col, int i)
{
	double high,low,bodyHigh,bodyLow;


	{
		bodyHigh = MathMax(Open[i],Close[i]);
		bodyLow  = MathMin(Open[i],Close[i]);
		high		= High[i];
		low		= Low[i];
	}

	Bar1[i] = low;	Candle1[i] = bodyLow;
	Bar2[i] = low;	Candle2[i] = bodyLow;


	switch(col)
	{
		case 1: 	Bar1[i] = high;	Candle1[i] = bodyHigh;	break;
		case 2: 	Bar2[i] = high;	Candle2[i] = bodyHigh;	break;

	}
}

//+------------------------------------------------------------------+
//| Custom indicator iteration function                              |
//+------------------------------------------------------------------+
int start()
{
	for(int i = MathMax(Bars-1-IndicatorCounted(),1); i>=0; i--)
	{
		double	rsi	= RSI(i);


				if(rsi > Overbought)		SetCandleColor(1,i);
		else	if(rsi < Oversold)		SetCandleColor(2,i);

	}


	return(0);
}
//+------------------------------------------------------------------+
Comments