RSI_channel_
Download script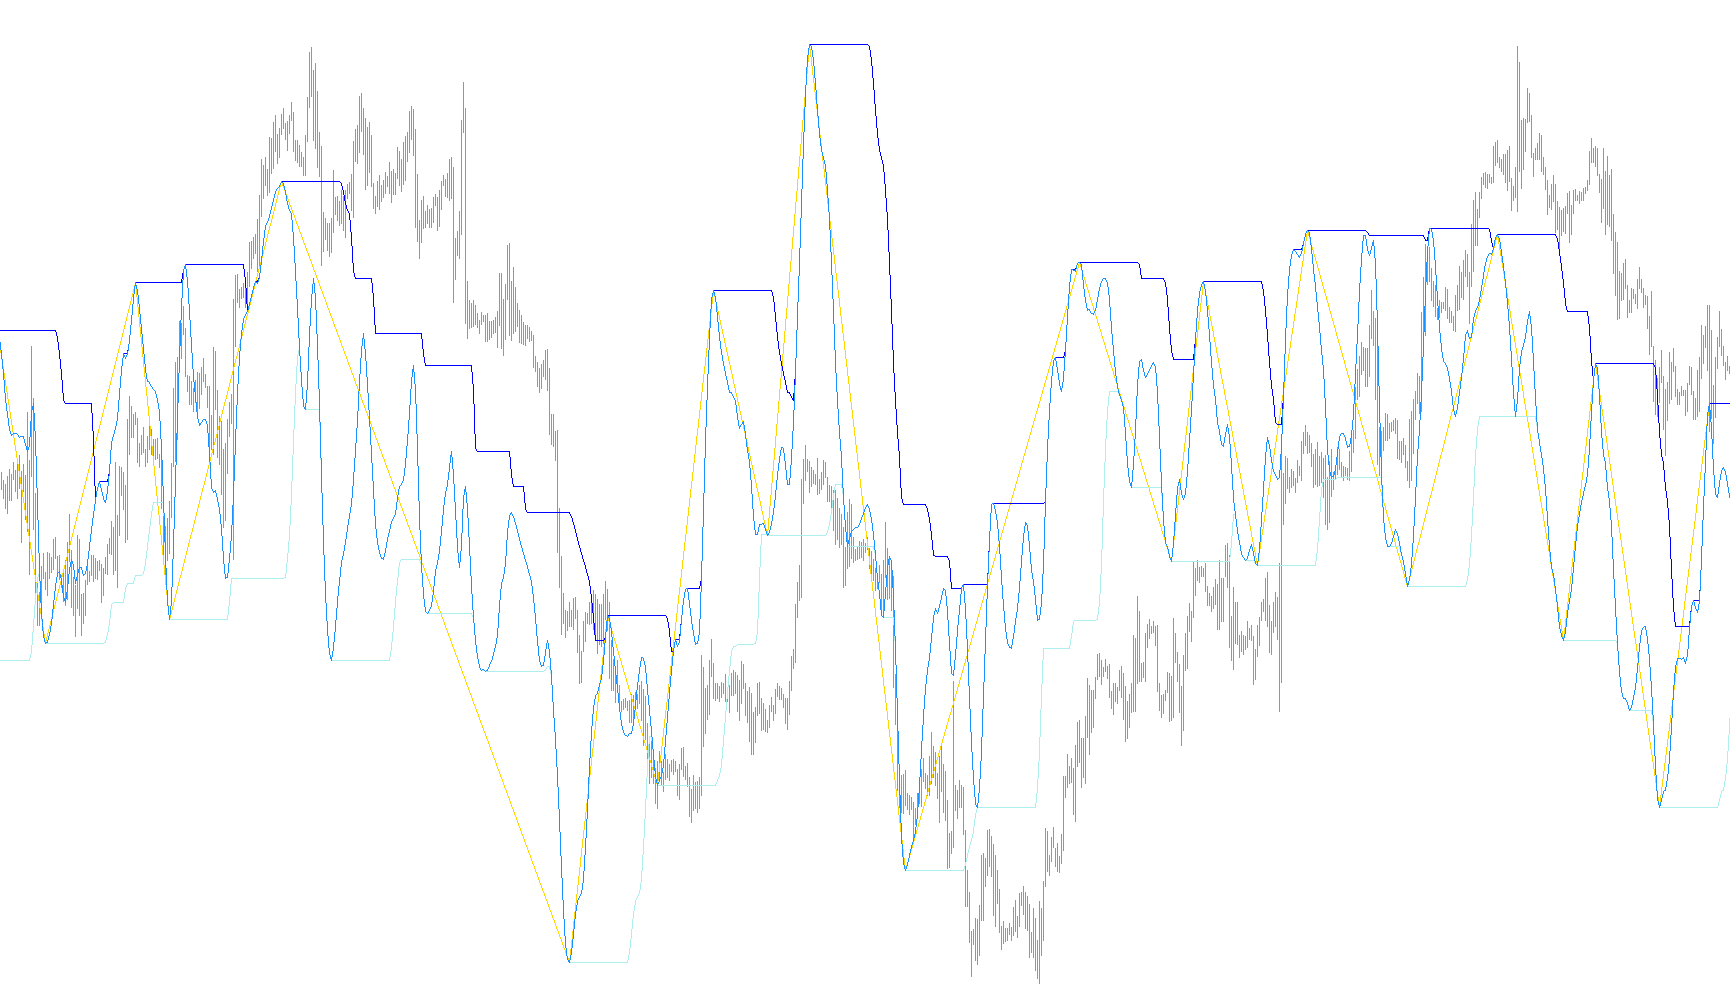
This indicator is designed to provide a more refined and smoothed view of market momentum by combining several sophisticated technical analysis components into a single visual display. Instead of showing raw, jagged price movements, it filters the data to highlight significant trends and price extremes.
Core Logic and Components
The tool operates through three main layers of processing:
1. Advanced Smoothing (T3 Filtering) At its foundation, the script uses a specialized smoothing technique known as the "T3" filter. Unlike standard moving averages that can be "laggy" (reacting too slowly to price changes) or too volatile (reacting too quickly and creating false signals), the T3 filter is designed to balance these two issues. It takes the Relative Strength Index (RSI)—a common measure of whether an asset is overbought or oversold—and applies a multi-layered mathematical smoothing process. This results in a much cleaner "momentum line" that follows the core trend without the noise of minor price fluctuations.
2. Dynamic Channel Creation Once the smoothed momentum line is established, the script identifies the highest and lowest values reached over a specific look-back period (the High/Low Period). By connecting these extremes, it creates a visual "channel." This channel acts as a boundary for market volatility, allowing you to see the range within which price momentum is currently oscillating.
3. Intelligent Trend Identification (ZigZag) The script includes a built-in "ZigZag" logic that automatically identifies significant turning points in the data. It looks for distinct peaks and valleys by comparing current highs and lows against previous ones. If a new high or low is detected that breaks the previous trend, the indicator marks these points. This helps traders visualize the "skeleton" of the market—the primary structure of price movement—stripping away the smaller, less relevant price movements.
Summary of Visual Behavior
- The Channels: These provide a visual "envelope," showing you the boundaries of recent momentum.
- The ZigZag Line: This connects the major highs and lows, helping you identify when a trend has actually reversed versus when it is simply experiencing a minor retracement.
- Combined Insight: By viewing these elements together, the indicator helps clarify whether the market is trending strongly, consolidating within a range, or preparing for a significant reversal.
//+------------------------------------------------------------------+
//|                                                  RSI channel.mq4 |
//|                                                           mladen |
//|                                                                  |
//|                                                                  |
//| original idea for this indicator found on                        |
//|     http://www.fxexpert.ru (RSI-2 posted by Dm_35)               |
//|                                                                  |
//+------------------------------------------------------------------+
#property copyright "mladen"
#property link      "mladenfx@gmail.com"

#property indicator_separate_window
#property indicator_buffers 4
#property indicator_color1  Gray
#property indicator_color2  Green
#property indicator_color3  Red
#property indicator_color4  Orange
#property indicator_width4  2
#property indicator_style1  STYLE_DOT

//
//
//
//
//
//

extern int    RSIPeriod     = 14;
extern int    RSIPrice      = PRICE_CLOSE;
extern int    HighLowPeriod = 30;
extern int    T3Period      =  8;
extern double T3Hot         = 0.7;
extern bool   T3Original    = false;
extern bool   ShowChannel   = true;
extern bool   ShowZigZag    = true;

//
//
//
//
//

double T3RSIBuffer[];
double HighBuffer[];
double LowBuffer[];
double ZigZagBuffer[];
double ZigZagLow[];
double ZigZagHigh[];

double emas[][6];
double alpha;
double c1;
double c2;
double c3;
double c4;


//+------------------------------------------------------------------+
//|                                                                  |
//+------------------------------------------------------------------+
//
//
//
//
//

int init()
{
   IndicatorBuffers(6);
   SetIndexBuffer(0,ZigZagBuffer);
   SetIndexBuffer(1,HighBuffer);
   SetIndexBuffer(2,LowBuffer);
   SetIndexBuffer(3,T3RSIBuffer);
   SetIndexBuffer(4,ZigZagLow);
   SetIndexBuffer(5,ZigZagHigh);
         SetIndexStyle(0,DRAW_SECTION);
         SetIndexEmptyValue(0,0);
         SetIndexEmptyValue(3,0);
         SetIndexEmptyValue(4,0);
         SetIndexEmptyValue(5,0);
         SetIndexLabel(0,NULL);

         if (ShowChannel)
            {
               SetIndexStyle(1,DRAW_LINE);
               SetIndexStyle(2,DRAW_LINE);
            }
         else
            {
               SetIndexStyle(1,DRAW_NONE);
               SetIndexStyle(2,DRAW_NONE);
            }

   //
   //
   //
   //
   //

      double a  = T3Hot;
             c1 = -a*a*a;
             c2 =  3*(a*a+a*a*a);
             c3 = -3*(2*a*a+a+a*a*a);
             c4 = 1+3*a+a*a*a+3*a*a;

      T3Period = MathMax(1,T3Period);
      if (T3Original)
           alpha = 2.0/(1.0 + T3Period);
      else alpha = 2.0/(2.0 + (T3Period-1.0)/2.0);

   //
   //
   //
   //
   //

   IndicatorShortName("RSI ("+RSIPeriod+","+HighLowPeriod+","+T3Period+")");
   return(0);
}
int deinit()
{
   return(0);
}

//+------------------------------------------------------------------+
//|                                                                  |
//+------------------------------------------------------------------+
//
//
//
//
//

int start()
{
   int counted_bars = IndicatorCounted();
   int lastZag;
   int i,limit;


   if(counted_bars<0) return(-1);
   if(counted_bars>0) counted_bars--;
           limit=Bars-counted_bars;
           if (ArrayRange(emas,0) != Bars) ArrayResize(emas,Bars);

   //
   //
   //
   //
   //

      if (ShowZigZag)
      for (lastZag=limit+1; lastZag<Bars; lastZag++) if (ZigZagLow[lastZag] != 0 || ZigZagHigh[lastZag] != 0) break;

   //
   //
   //
   //
   //

   for(i=limit; i>=0; i--)
   {
      T3RSIBuffer[i] = iT3(iRSI(NULL,0,RSIPeriod,RSIPrice,i),i);
      LowBuffer[i]   = T3RSIBuffer[ArrayMinimum(T3RSIBuffer,HighLowPeriod,i)];
      HighBuffer[i]  = T3RSIBuffer[ArrayMaximum(T3RSIBuffer,HighLowPeriod,i)];
         if (!ShowZigZag) continue;

      //
      //
      //
      //
      //

         ZigZagLow[i]  = 0;
         ZigZagHigh[i] = 0;
         if (LowBuffer[i] < LowBuffer[i+1])
            {
               if (ZigZagBuffer[lastZag] == LowBuffer[lastZag])
                   ZigZagBuffer[lastZag] = 0;
                   ZigZagBuffer[i]       =  LowBuffer[i];
                   ZigZagLow[i]          =  LowBuffer[i];
                                 lastZag = i;
                                 continue;
            }
         if (HighBuffer[i] > HighBuffer[i+1])
            {
               if (ZigZagBuffer[lastZag] == HighBuffer[lastZag])
                   ZigZagBuffer[lastZag] = 0;
                   ZigZagBuffer[i]       =  HighBuffer[i];
                   ZigZagHigh[i]         =  HighBuffer[i];
                                 lastZag = i;
                                 continue;
            }
         if (ZigZagBuffer[i] != 0)
            {
               ZigZagBuffer[i] = 0;
               for (lastZag=i+1; lastZag<Bars; lastZag++)
               {
                  if (ZigZagLow[lastZag]  != 0) { ZigZagBuffer[lastZag] = ZigZagLow[lastZag];  break; }
                  if (ZigZagHigh[lastZag] != 0) { ZigZagBuffer[lastZag] = ZigZagHigh[lastZag]; break; }
               }
            }
   }

   //
   //
   //
   //
   //

   return(0);
}

//+------------------------------------------------------------------+
//|                                                                  |
//+------------------------------------------------------------------+
//
//
//
//
//

double iT3(double price,int shift)
{
   int i = Bars-shift-1;
   if (i < 1)
      {
         emas[i][0] = price;
         emas[i][1] = price;
         emas[i][2] = price;
         emas[i][3] = price;
         emas[i][4] = price;
         emas[i][5] = price;
      }
   else
      {
         emas[i][0] = emas[i-1][0]+alpha*(price     -emas[i-1][0]);
         emas[i][1] = emas[i-1][1]+alpha*(emas[i][0]-emas[i-1][1]);
         emas[i][2] = emas[i-1][2]+alpha*(emas[i][1]-emas[i-1][2]);
         emas[i][3] = emas[i-1][3]+alpha*(emas[i][2]-emas[i-1][3]);
         emas[i][4] = emas[i-1][4]+alpha*(emas[i][3]-emas[i-1][4]);
         emas[i][5] = emas[i-1][5]+alpha*(emas[i][4]-emas[i-1][5]);
      }
   return(c1*emas[i][5] + c2*emas[i][4] + c3*emas[i][3] + c4*emas[i][2]);
}
Comments