RSI_Coloured_Final
Download script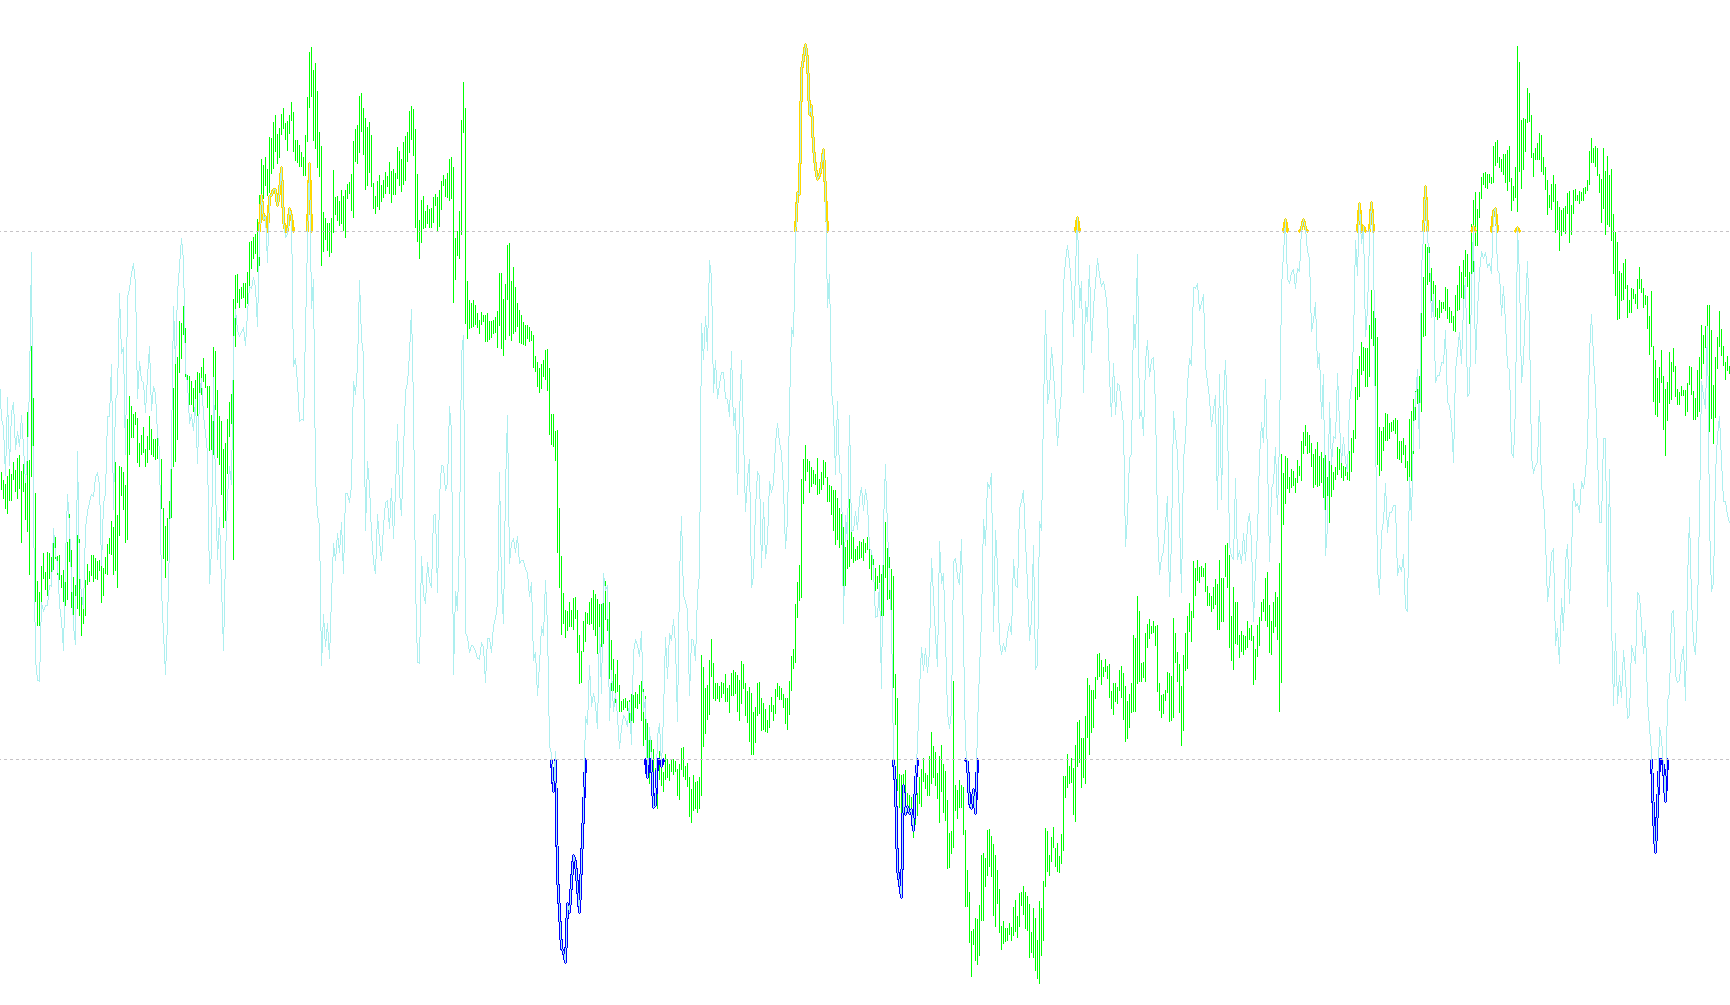
This technical tool is designed to enhance the standard Relative Strength Index (RSI) by providing a more visual and structured way to identify overbought and oversold market conditions. While a standard RSI provides a single moving line, this script adds specific logic to highlight "signal zones" and prevent the visual clutter of lines that frequently exit the primary trading boundaries.
Core Functionality
The indicator focuses on three primary behaviors to help traders make clearer decisions:
- Dynamic Boundary Tracking: The script monitors the RSI values against two customizable thresholds (traditionally 70 for overbought and 30 for oversold). Instead of just showing you the raw data, it creates specific visual signals when the RSI enters or leaves these "danger zones."
- Smart Filtering Logic: A key feature of this script is its ability to handle price action that "lingers" outside of the thresholds. It includes logic to ensure that signal lines are drawn logically—connecting the peaks and valleys of the RSI as it crosses into extreme territory, while keeping the middle range clean.
- Transparency and Visual Customization: Users have the option to toggle the visibility of the primary RSI line when it sits between the high and low levels. This "Transparent" mode allows you to focus exclusively on the extreme price action, effectively hiding the "noise" of a stable market so you can see only the moments of potential reversal.
Key Features for the User
- Customizable Sensitivity: You can adjust the RSI period (the look-back window) and choose which price data point (Open, High, Low, Close, etc.) the indicator should base its calculations on.
- Signal Width Control: The script allows you to modify the thickness of the signal lines, making it easier to distinguish between the primary trend and the extreme signals on a busy chart.
- Adaptive Mapping: The logic is designed to bridge the gap between consecutive candles. If the RSI stays above a high level for multiple bars, the script manages how those lines are drawn to ensure they remain connected and readable, rather than appearing as disconnected fragments.
Summary of Use
This tool acts as a visual filter. It takes the complex movement of the RSI and distills it into clear signals at the top and bottom of the indicator window. It is specifically designed for traders who want to identify high-probability reversal areas while minimizing the visual distractions caused by standard moving averages in the middle of the range.
#property copyright "TheXpert"
#property link      "theforexpert@gmail.com"

#property indicator_separate_window

#property indicator_maximum 100
#property indicator_minimum 0

#property indicator_buffers 3

#property indicator_color1 DeepSkyBlue
#property indicator_color2 Red
#property indicator_color3 Khaki

//---- input parameters
extern string  RSIPeriod_Desc    =  "Ïåðèîä RSI";
extern int     RSIPeriod         =  14;
extern string  RSIPrice_Desc     =  "Öåíà RSI: 0-Close, 1-Open, 2-High, 3-Low, 4-Median, 5-Typical, 6-Weighted";
extern int     RSIPrice          =  0;
extern string  HighLevel_Desc    =  "Âåðõíèé óðîâåíü RSI";
extern int     HighLevel         =  70;
extern string  LowLevel_Desc     =  "Íèæíèé óðîâåíü RSI";
extern int     LowLevel          =  30;
extern string  MarkFalse_Desc    =  "Ìàðêèðîâàòü èëè íåò áàðû, êîòîðûå ïðè ôîðìèðîâàíèè çàëàçèëè çà óðîâíè";
extern bool    MarkFalse         =  false;
extern string  Transparent_Desc  =  "Ðèñîâàòü RSI ïîâåðõ öâåòíûõ óðîâíåé";
extern bool    Transparent       =  true;
extern string  Width_Desc        =  "Øèðèíà ñèãíàëüíûõ ëèíèé";
extern int     Width             =  3;

//---- buffers
double RSI[];
double Inner[];
double Higher[];
double Lower[];


/// \brief Equal to ternar operator
/// needed = Condition ? IfTrue : IfFalse;
/// \param IfTrue
/// \param IfFalse
/// \return matching value from parameters
double DoubleIf(bool Condition, double IfTrue, double IfFalse)
{
   if (Condition) return (IfTrue);
   else           return (IfFalse);
}

//+------------------------------------------------------------------+
//| Custom indicator initialization function                         |
//+------------------------------------------------------------------+
int init()
{
   IndicatorBuffers(4);

   SetIndexBuffer(0, Higher);
   SetIndexBuffer(1, Lower);
   SetIndexBuffer(2, Inner);

   SetIndexBuffer(3, RSI);

   SetLevelValue(0, HighLevel);
   SetLevelValue(1, LowLevel);

   SetIndexLabel(0, "RSI");
   SetIndexLabel(1, "Âûøå óðîâíÿ");
   SetIndexLabel(2, "Íèæå óðîâíÿ");

   SetIndexStyle(0, DRAW_LINE, EMPTY, Width);
   SetIndexStyle(1, DRAW_LINE, EMPTY, Width);

   SetIndexDrawBegin(0, RSIPeriod + 1);
   SetIndexDrawBegin(1, RSIPeriod + 1);
   SetIndexDrawBegin(2, RSIPeriod + 1);

   IndicatorShortName("Öâåòíîé RSI");

   IndicatorDigits(2);

   return(0);
}

int start()
{
   int ToCount = Bars - IndicatorCounted();

   for (int cnt = ToCount - 1; cnt >= 0; cnt--)
   {
      RSI[cnt] = iRSI(NULL, 0, RSIPeriod, RSIPrice, cnt);

      int depth = 2;
      if (MarkFalse)
      {
         depth = 1;
      }

      for (int i = cnt + depth - 1; i >= cnt; i--)
      {
         Higher[i] = EMPTY_VALUE;
         Lower[i] = EMPTY_VALUE;

         Inner[i] = RSI[i];

         if (!Transparent)
         {
            if (RSI[i] <= LowLevel)
            {
               Inner[i] = DoubleIf(RSI[i + 1] > LowLevel, LowLevel, EMPTY_VALUE);
            }
            else
            {
               Inner[i] = DoubleIf(RSI[i + 1] <= LowLevel, LowLevel, RSI[i]);
            }


            if (RSI[i] >= HighLevel)
            {
               Inner[i] = DoubleIf(RSI[i + 1] < HighLevel, HighLevel, EMPTY_VALUE);
            }
            else
            {
               Inner[i] = DoubleIf(RSI[i + 1] >= HighLevel, HighLevel, Inner[i]);
            }
         }

         if(RSI[i] >= HighLevel)
         {
            Higher[i] = RSI[i];
            Higher[i + 1] = DoubleIf(RSI[i + 1] >= HighLevel, RSI[i + 1], HighLevel);
         }
         else if(RSI[i + 1] >= HighLevel)
         {
            Higher[i] = HighLevel;
            Higher[i + 1] = RSI[i + 1];
         }


         if(RSI[i] <= LowLevel)
         {
            Lower[i] = RSI[i];
            Lower[i + 1] = DoubleIf(RSI[i + 1] <= LowLevel, RSI[i + 1], LowLevel);
         }
         else if(RSI[i + 1] <= LowLevel)
         {
            Lower[i] = LowLevel;
            Lower[i + 1] = RSI[i + 1];
         }
      }
   }

   return(0);
}
Comments