RSI_Filter_vX2D2alert_mtf_003
Download script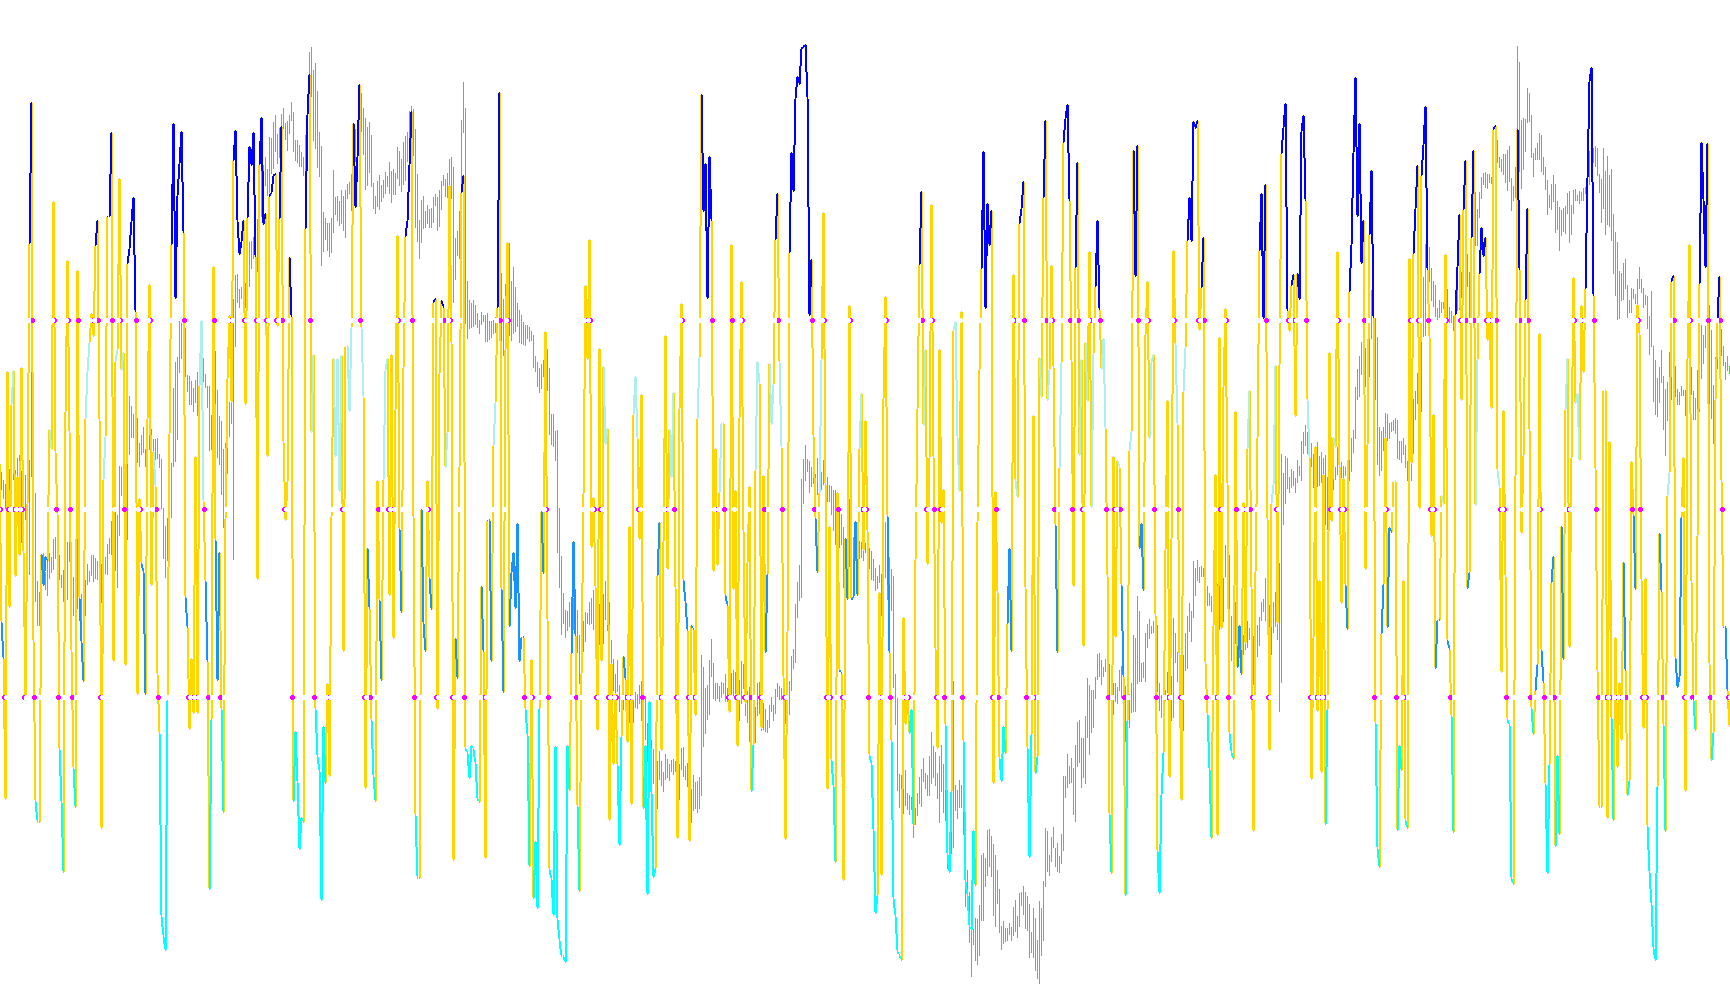
This tool is designed as a multi-timeframe visual filter for traders who use the Relative Strength Index (RSI) to determine market momentum. It simplifies complex technical analysis by categorizing price action into distinct trend "zones" and providing automated notifications when the market shifts between these states.
Core Functionality
The primary purpose of this script is to analyze RSI data from a specific higher timeframe (e.g., viewing the 4-hour trend while trading on a 15-minute chart) and display that information directly on your current screen. It categorizes the market into four distinct trend types based on where the RSI value sits relative to specific thresholds:
- Strong Uptrend: Identified when the RSI is above the upper trigger level (default 70).
- Mild Uptrend: Identified when the RSI is between the middle line (50) and the upper trigger level.
- Mild Downtrend: Identified when the RSI is between the lower trigger level (30) and the middle line (50).
- Strong Downtrend: Identified when the RSI is below the lower trigger level (30).
Visual Features
The script offers several ways to visualize these trends:
- Trend Lines & Bars: Depending on your settings, it can draw smooth lines or histograms representing the current trend state.
- Signal Arrows: It places visual markers (arrows) on the chart at specific "cross-over" points. These appear when the RSI breaks through key levels, such as crossing the 50 mid-line or breaching the upper/lower trigger boundaries.
- Data Points: It can display dots or bars to highlight exactly where the data aligns with the timeframe being analyzed.
Alert System
To help traders who cannot watch their screens constantly, the script includes an automated notification system. It monitors for "cross-overs" and sends real-time alerts for several key events:
- Midline Crosses: Alerts you when the market shifts from a general uptrend to a downtrend (or vice versa) by crossing the 50 level.
- Trigger Breaches: Specific alerts are triggered when the RSI moves into "Strong" territory (above 70 or below 30) or exits it.
Summary for the User
This indicator acts as a "trend filter." Instead of just showing you a raw RSI line, it tells you what that line actually means for your trading strategy. It helps you stay on the right side of the market by visually highlighting whether the higher timeframe is currently bullish, bearish, or neutral, and alerts you the moment that trend begins to change.
//+------------------------------------------------------------------+
//|RSI_Filter                                       CCIFilter vX.mq4 |
//|                                                                  |
//|                                                      mod by Raff |
//+------------------------------------------------------------------+
// mtf 2008fxtsd  ki

#property copyright "Copyright © 2006, Forex-TSD.com "
#property link      "http://www.forex-tsd.com/"

#property indicator_separate_window
#property indicator_buffers 8
#property indicator_color1 Silver
#property indicator_color2 Blue
#property indicator_color3 DarkTurquoise
#property indicator_color4 Tomato
#property indicator_color5 Magenta
#property indicator_color6 Red
#property indicator_color7 Lime
#property indicator_color8 Yellow

#property indicator_width1 3
#property indicator_width2 5
#property indicator_width3 3
#property indicator_width4 3
#property indicator_width5 5
#property indicator_width6 3
#property indicator_width7 3
#property indicator_width8 1
//#property  indicator_level1  0
#property indicator_level1  70
#property indicator_level2  50
#property indicator_level3  30

#property indicator_levelcolor OrangeRed


//---- input parameters
extern int    RSI_Period             = 3;
extern int    RSI_Price              = 0;
extern int    UpperTriggerLevel     =  70;
extern int    LowerTriggerLevel     =  30;
//extern int    CriticalLevel         = 250;
extern int    TimeFrame = 0;
extern string TimeFrames = "M1;5,15,30,60H1;240H4;1440D1;10080W1;43200MN|0-CurrentTF";

extern bool   ShowBARS             = false;
extern int    BarWidth             = 4;
extern int    LineWidth            = 2;

extern bool   Show_Dots            = true;

extern bool   ZeroCrossAlerts                = true;
extern bool   LevelCrossAlerts               = true;

//extern string CriticalLevelAlert    = "CCI Critical Level";
extern string ZeroCrossUpAlert          = "RSI Level 50 Cross Up; ";
extern string ZeroCrossDnAlert          = "RSI Level 50 Cross Dn; ";
extern string UpperTriggerBuyAlert  = "RSI Upper Trigger CrossUp; ";
extern string UpperTriggerSellAlert = "RSI Upper Trigger CrossDn; ";
extern string LowerTriggerBuyAlert  = "RSI Lower Trigger CrossUp; ";
extern string LowerTriggerSellAlert = "RSI Lower Trigger CrossDn; ";
extern int    MaxBarsToCount           = 1500;
extern string note_Price = "Price(C O1 H2 3L 4M 5T W6)";

//---- indicator buffers
double RSI[];
double UpBuffer1[];
double UpBuffer2[];
double DnBuffer1[];
double DnBuffer2[];
double DnArr[];
double UpArr[];
double RSI_Dot[];

//+------------------------------------------------------------------+
//| Custom indicator initialization function                         |
//+------------------------------------------------------------------+
  int init()
  {
   IndicatorBuffers(8);


   SetIndexStyle(0,DRAW_LINE,0,LineWidth);
   SetIndexStyle(1,DRAW_LINE,0,LineWidth);
   SetIndexStyle(2,DRAW_LINE,0,LineWidth);
   SetIndexStyle(3,DRAW_LINE,0,LineWidth);
   SetIndexStyle(4,DRAW_LINE,0,LineWidth);
   if (ShowBARS)
   {
   SetIndexStyle(1,DRAW_HISTOGRAM,0,BarWidth);
   SetIndexStyle(2,DRAW_HISTOGRAM,0,BarWidth);
   SetIndexStyle(3,DRAW_HISTOGRAM,0,BarWidth);
   SetIndexStyle(4,DRAW_HISTOGRAM,0,BarWidth);
   }

   SetIndexEmptyValue(5,EMPTY_VALUE);
   SetIndexEmptyValue(6,EMPTY_VALUE);

   SetIndexStyle  (5,DRAW_ARROW);
   SetIndexArrow  (5,159);
   SetIndexBuffer (5,DnArr);
   SetIndexStyle  (6,DRAW_ARROW);
   SetIndexArrow  (6,159);
   SetIndexBuffer (6,UpArr);

   SetIndexEmptyValue(7,EMPTY_VALUE);
   SetIndexArrow(7,158);     //159 115
   SetIndexStyle(7,DRAW_NONE);
   if(Show_Dots && !ShowBARS)
   SetIndexStyle(7,DRAW_ARROW);


   SetIndexBuffer(0,RSI);
   SetIndexBuffer(1,UpBuffer1);
   SetIndexBuffer(2,UpBuffer2);
   SetIndexBuffer(3,DnBuffer1);
   SetIndexBuffer(4,DnBuffer2);
   SetIndexBuffer(5,DnArr);
   SetIndexBuffer(6,UpArr);
   SetIndexBuffer(7,RSI_Dot);

   IndicatorDigits(MarketInfo(Symbol(),MODE_DIGITS));

      TimeFrame= MathMax(TimeFrame,Period());

      switch(TimeFrame)
     {
      case 1 : string TimeFrameStr= "M1";  break;
      case 5 : TimeFrameStr=        "M5";  break;
      case 15 : TimeFrameStr=       "M15"; break;
      case 30 : TimeFrameStr=       "M30"; break;
      case 60 : TimeFrameStr=       "H1";  break;
      case 240 : TimeFrameStr=      "H4";  break;
      case 1440 : TimeFrameStr=     "D1";  break;
      case 10080 : TimeFrameStr=    "W1";  break;
      case 43200 : TimeFrameStr=    "MN1"; break;
      default : TimeFrameStr= "TF0";
     }

   string short_name;
   short_name="RSI Filter ("+RSI_Period+") ["+TimeFrameStr+"] L("+UpperTriggerLevel+", "+LowerTriggerLevel+")";
   IndicatorShortName(short_name);

   SetIndexLabel(0,"RSI ("+RSI_Period+")["+TimeFrameStr+"]");
   SetIndexLabel(1,"UpTrend");
   SetIndexLabel(2,"Mild UpTrend");
   SetIndexLabel(3,"Mild DownTrend");
   SetIndexLabel(4,"DownTrend");
   SetIndexLabel(5,"RSI ("+RSI_Period+")["+TimeFrameStr+"]Dn");
   SetIndexLabel(6,"RSI ("+RSI_Period+")["+TimeFrameStr+"]Up");

   SetIndexDrawBegin(0,RSI_Period);
   SetIndexDrawBegin(1,RSI_Period);
   SetIndexDrawBegin(2,RSI_Period);
   SetIndexDrawBegin(3,RSI_Period);
   SetIndexDrawBegin(4,RSI_Period);
   SetIndexDrawBegin(5,RSI_Period);
   SetIndexDrawBegin(6,RSI_Period);
   SetIndexDrawBegin(7,RSI_Period);

   return(0);
  }

//+------------------------------------------------------------------+
//| CCIFilter                                                        |
//+------------------------------------------------------------------+
int start()
  {
   int shift,trend;
   datetime TimeArray[];
   ArrayCopySeries(TimeArray,MODE_TIME,Symbol(),TimeFrame);


   double CCI0, CCI1;
   double UpDnZero, UpDnBuffer;


   int    limit,y, counted_bars=IndicatorCounted();
   limit= Bars-counted_bars;
   limit= MathMax(limit,TimeFrame/Period());
   limit= MathMin(limit,MaxBarsToCount);

   for(shift=0,y=0;shift<limit;shift++)
   {
   if (Time[shift]<TimeArray[y]) y++;

     RSI_Dot[shift]  =EMPTY_VALUE;
     DnArr[shift]    =EMPTY_VALUE;
     UpArr[shift]    =EMPTY_VALUE;
  	  RSI[shift]      =EMPTY_VALUE;

	  CCI0=iRSI(NULL,TimeFrame,RSI_Period,RSI_Price,y);
	  CCI1=iRSI(NULL,TimeFrame,RSI_Period,RSI_Price,y+1);

  	  if(Time[shift]==TimeArray[y])
  	  {
  	  RSI_Dot[shift]=iRSI(NULL,TimeFrame,RSI_Period,RSI_Price,y);

     if  (ShowBARS) RSI_Dot[shift]=0;
     }

  	  UpDnZero=0; UpDnBuffer=1;
     if (!ShowBARS) {UpDnZero=EMPTY_VALUE; UpDnBuffer=CCI0; RSI[shift]=CCI0;}

  	  UpBuffer1[shift]=UpDnZero;
  	  UpBuffer2[shift]=UpDnZero;
  	  DnBuffer1[shift]=UpDnZero;
  	  DnBuffer2[shift]=UpDnZero;

	  if (CCI0>UpperTriggerLevel)  UpBuffer1[shift]=UpDnBuffer;
	  if (CCI0>50 && CCI0<=UpperTriggerLevel) UpBuffer2[shift]=UpDnBuffer;
	  if (CCI0<50 && CCI0>=LowerTriggerLevel) DnBuffer1[shift]=UpDnBuffer;
	  if (CCI0<LowerTriggerLevel)  DnBuffer2[shift]=UpDnBuffer;

     if (CCI0>50 && CCI1<=50) {if(!ShowBARS) UpArr[shift]=50; if(shift==0 && ZeroCrossAlerts) Alerts(ZeroCrossUpAlert);}
     if (CCI0<50 && CCI1>=50) {if(!ShowBARS) DnArr[shift]=50; if(shift==0 && ZeroCrossAlerts) Alerts(ZeroCrossDnAlert);}
     if (CCI0>UpperTriggerLevel && CCI1<=UpperTriggerLevel) {if(!ShowBARS) UpArr[shift]=UpperTriggerLevel; if(shift==0 && LevelCrossAlerts) Alerts(UpperTriggerBuyAlert);}
     if (CCI0<UpperTriggerLevel && CCI1>=UpperTriggerLevel) {if(!ShowBARS) DnArr[shift]=UpperTriggerLevel; if(shift==0 && LevelCrossAlerts) Alerts(UpperTriggerSellAlert);}
     if (CCI0>LowerTriggerLevel && CCI1<=LowerTriggerLevel) {if(!ShowBARS) UpArr[shift]=LowerTriggerLevel; if(shift==0 && LevelCrossAlerts) Alerts(LowerTriggerBuyAlert);}
     if (CCI0<LowerTriggerLevel && CCI1>=LowerTriggerLevel) {if(!ShowBARS) DnArr[shift]=LowerTriggerLevel; if(shift==0 && LevelCrossAlerts) Alerts(LowerTriggerSellAlert);}
//     if (MathAbs(CCI0)>CriticalLevel && MathAbs(CCI1)<=CriticalLevel) {if(shift==0) Alerts(CriticalLevelAlert);}
//     if (MathAbs(CCI0)<CriticalLevel && MathAbs(CCI1)>=CriticalLevel) {if(shift==0) Alerts(CriticalLevelAlert);}
	}

	return(0);
 }

void Alerts(string AlertText)
  {

    static datetime timeprev;
    if(timeprev<iTime(NULL,0,0))
      {timeprev=iTime(NULL,0,0);
         Alert( "RSI Filter ("+RSI_Period+") TF["+TimeFrame+"]"
         +UpperTriggerLevel+", "+LowerTriggerLevel+": ", AlertText,
         " ",Symbol(),", chart M",Period(),"  at  ", Close[0],"  -  ", TimeToStr(CurTime(),TIME_SECONDS));}
  }
Comments