RSI_X2
Download script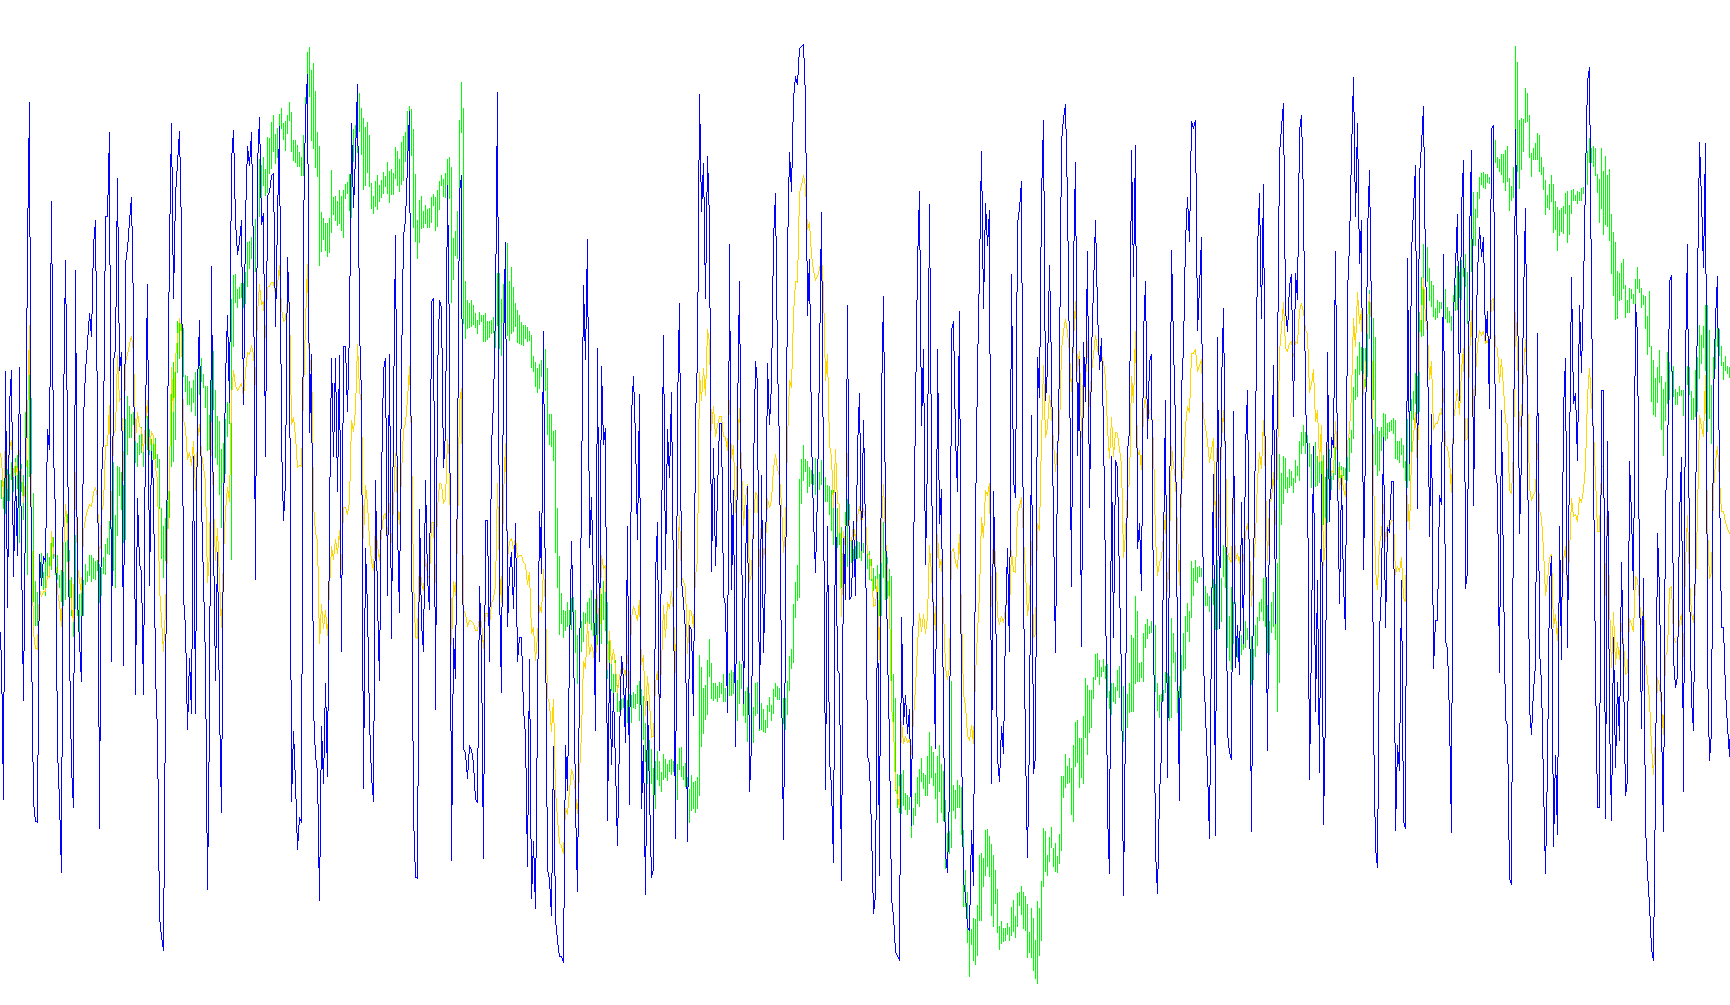
This script is designed as a visual tool for traders to monitor market momentum by displaying two different types of Relative Strength Index (RSI) readings simultaneously in a single window. The RSI is a common technical indicator used to determine whether an asset is being overbought or oversold.
How it Works
The logic of this tool relies on comparing two distinct timeframes of market movement:
- Primary Momentum Tracking: The script first calculates a standard RSI based on a larger set of data (defined by a "Period" of 13). This is intended to show the broader trend and general strength of the market over a longer duration.
- Secondary Momentum Tracking: Simultaneously, the script calculates a second RSI using a much smaller, faster set of data (a "Period" of 3). This serves to highlight immediate, short-term fluctuations in price.
Visual Representation
By plotting both of these calculations on your chart at the same time, the tool allows you to see the relationship between "big picture" momentum and "quick" momentum.
- The First Line: Represents the smoother, more stable momentum of the asset.
- The Second Line: Represents the rapid, high-sensitivity movements of the asset.
The Goal for the User
The purpose of this script is to provide a clearer picture of market dynamics than a single indicator could offer alone. By observing how the fast-moving line reacts in relation to the slower-moving line, traders can better identify potential shifts in price direction or recognize when short-term spikes are deviating significantly from the primary trend.
//+------------------------------------------------------------------+
//|                                                      RSI_X2.mq4  |
//|                                                                  |
//+------------------------------------------------------------------+
#property copyright "Image3022"

#property indicator_separate_window
#property indicator_minimum 0
#property indicator_maximum 100
#property indicator_buffers 2
#property indicator_color1 DodgerBlue
#property indicator_color2 Red
#property indicator_width1 1
#property indicator_width2 1

extern int     RSI_Period       = 13,
               RSI_Period2      = 3;


double         RSIBuffer[],
               RSI2Buffer[];

//+------------------------------------------------------------------+
//| Custom indicator initialization function                         |
//+------------------------------------------------------------------+
int init()
{
   SetIndexStyle(0,DRAW_LINE);
   SetIndexStyle(1,DRAW_LINE);

   SetIndexBuffer(0,RSIBuffer);
   SetIndexBuffer(1,RSI2Buffer);

   SetIndexLabel(0,"RSI");
   SetIndexLabel(1,"RSI 2");


   return(0);
}
//+------------------------------------------------------------------+
//| Custor indicator deinitialization function                       |
//+------------------------------------------------------------------+
int deinit()
{

   return(0);
}
//+------------------------------------------------------------------+
//| Custom indicator iteration function                              |
//+------------------------------------------------------------------+
int start()
{
   int limit;
   int counted_bars=IndicatorCounted();
   if(counted_bars<0) counted_bars=0;
   if(counted_bars>0) counted_bars--;
   limit=Bars-counted_bars;

   for(int i = 0 ;i < limit ;i++){
      RSIBuffer[i]      = iRSI(Symbol(),0,RSI_Period,PRICE_CLOSE,i);
   }

   for(int x = 0; x < (ArraySize(RSIBuffer));x++){
      RSI2Buffer[x] = iRSI(Symbol(),0,RSI_Period2,PRICE_CLOSE,x);
   }
//   SetLevelValue(1,RSIBuffer[0]);
   return(0);
}
//+------------------------------------------------------------------+
Comments