RSIOMA_v3
Download script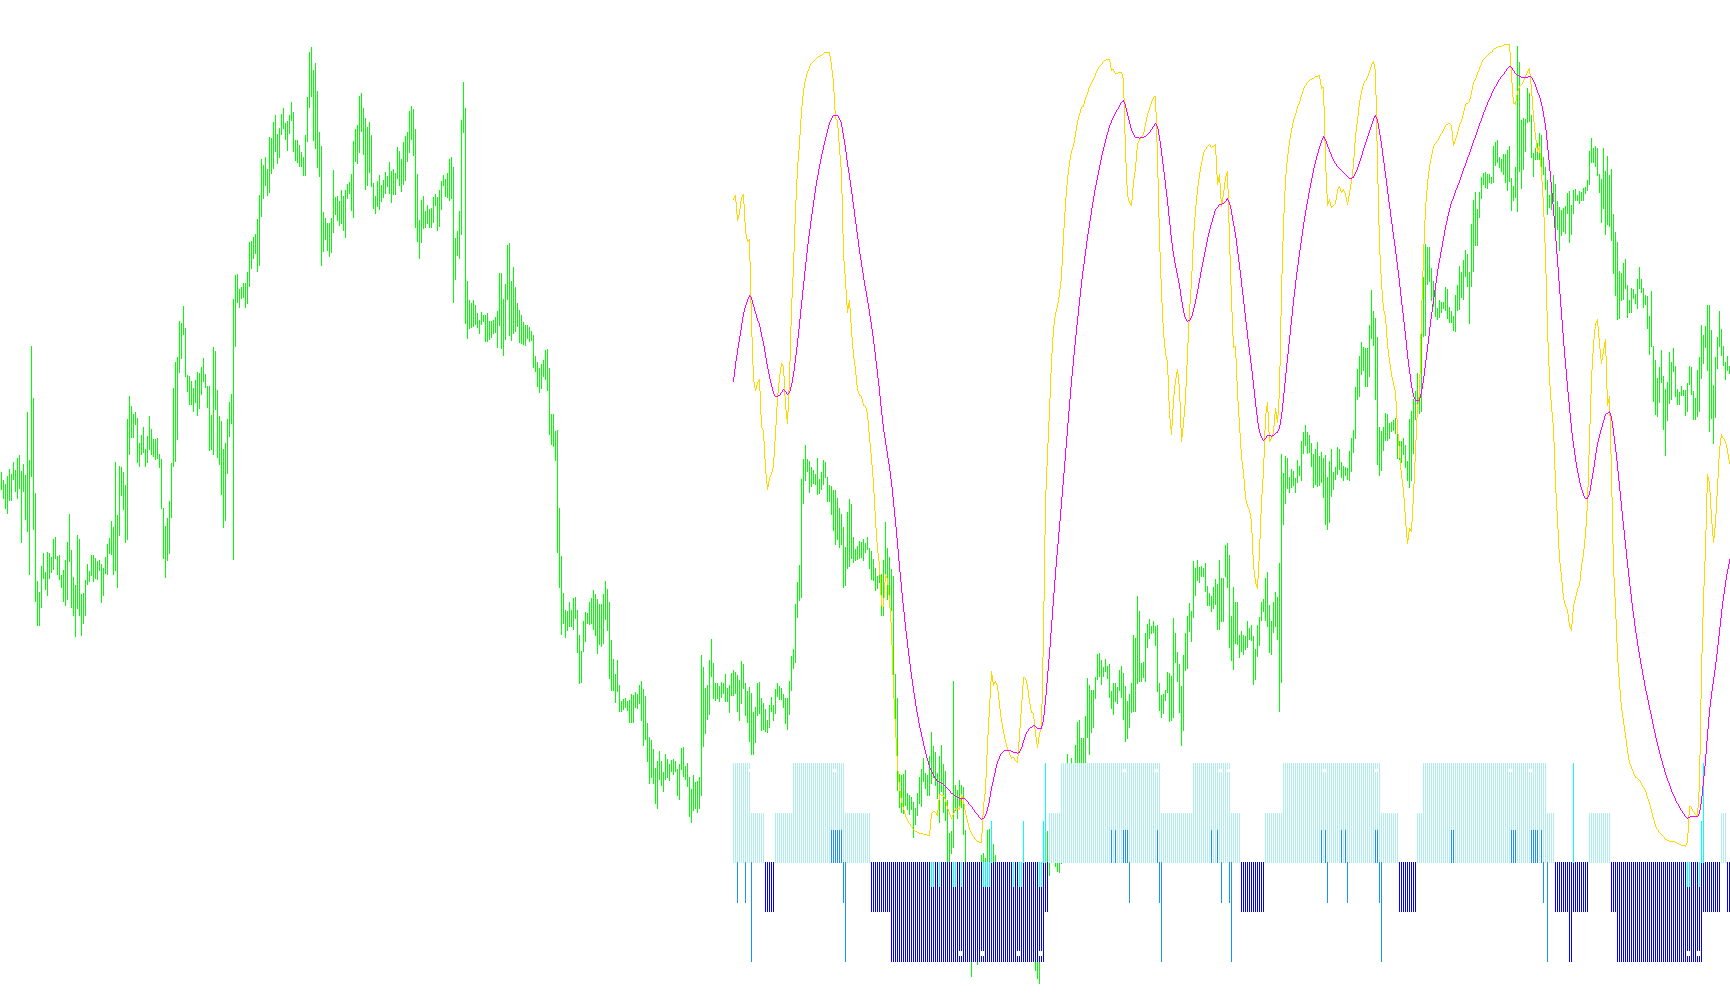
The RSIOMA script is a technical analysis tool designed to help traders identify momentum trends, potential reversals, and overbought or oversold conditions by smoothing out price data. Rather than looking at raw price movements alone, it processes the data through multiple layers of averaging to create a cleaner, more readable visual representation of market sentiment.
Core Data Processing
The logic begins by taking standard price data (such as closing prices) and applying a Moving Average. Instead of calculating an indicator directly from the price, the script then applies a Relative Strength Index (RSI) calculation onto that smoothed moving average. This "double-layer" processing helps filter out market "noise," ensuring that the resulting signals are based on established trends rather than temporary price fluctuations.
Visual Components and Trends
The indicator provides several visual layers to help traders interpret different market states:
- Moving Average Line: A primary smoothed line tracks the general momentum of the asset.
- Trend Identification: The script identifies "Main Trends" by comparing current values against specific thresholds (typically 30 and 70). It visually highlights these areas to show when the market is in a sustained bullish or bearish state.
- Trigger Zones: Horizontal dotted lines are drawn on the chart to mark key transition zones (such as 20 and 80). These serve as visual boundaries for identifying extreme momentum.
Signal Generation
The script automates the detection of specific price actions through three main types of signals:
- Momentum Shifting: It detects when the core value crosses the midpoint (50), signaling a shift from bearish to bullish sentiment (or vice versa).
- Overbought/Oversold Detection: The logic monitors the lower and upper boundaries. If the data enters these zones and begins to reverse direction, the script identifies potential "exhaustion" points where the price might be ready to turn around.
- Crossover Signals: A key feature of this script is the "CrossSig" logic. It compares the smoothed RSI value against its own Moving Average. When the RSI line crosses above its moving average, it generates an upward signal; when it crosses below, it generates a downward signal. These are represented as specific icons (arrows) on the chart to provide clear entry or exit cues.
Summary of User Experience
For a trader, this script transforms complex mathematical calculations into a simplified visual dashboard. It highlights where the market is "stretched" too far, identifies the underlying trend through smoothed averages, and places clear markers on the chart to indicate exactly where momentum is shifting in favor of either buyers or sellers.
//+--------------------------------------------------------------------------------+
//|      RSIOMA_v3   by  Mladen  &  fxbs       Kalenzo              | fxtsd.com |ik|
//|  Hornet(RSIOnArray)  2007, FxTSD.com       MetaQuotes Software Corp.           |
//|  Hist & Levels 20/80;30/70  CrossSig       web: http://www.fxservice.eu        |
//|  Rsioma/MaRsioma X sig ()                  email: bartlomiej.gorski@gmail.com  |
//+--------------------------------------------------------------------------------+

#property copyright "Copyright © 2007, MetaQuotes Software Corp."
#property link      "http://www.metaquotes.net/ Kalenzo|bartlomiej.gorski@gmail.com "

#property indicator_separate_window
#property indicator_buffers   8
#property indicator_minimum -20
#property indicator_maximum 110
#property indicator_color1     Blue
#property indicator_color2     Red
#property indicator_color3     Green
#property indicator_color4     Magenta
#property indicator_color5     DodgerBlue
#property indicator_color6     BlueViolet
#property indicator_color7     Aqua//DeepSkyBlue
#property indicator_color8     DeepPink //Crimson
//
#property indicator_width1  2
#property indicator_width4  2
#property indicator_width5  2
#property indicator_width7  1
#property indicator_width8  1
//
#property indicator_level1 100
#property indicator_level2 80   //76.4
#property indicator_level3 70   //61.8
#property indicator_level4 50
#property indicator_level5 30   //38.2
#property indicator_level6 20   //23.6
#property indicator_levelcolor DarkSlateGray
//------------------------------------------

//---- input parameters
//

extern int    RSIOMA          = 14;
extern int    RSIOMA_MODE     = MODE_EMA;
extern int    RSIOMA_PRICE    = PRICE_CLOSE;
extern int    Ma_RSIOMA       = 21;
extern int    Ma_RSIOMA_MODE  = MODE_EMA;

extern double BuyTrigger          = 20.00;
extern double SellTrigger         = 80.00;
extern color  BuyTriggerColor     = Magenta;
extern color  SellTriggerColor    = DodgerBlue;

extern double MainTrendLong       = 70.00;
extern double MainTrendShort      = 30.00;
extern color  MainTrendLongColor  = Green;
extern color  MainTrendShortColor = Red;
extern double MajorTrend          = 50;
extern color  marsiomaXupSigColor = Aqua;//DeepSkyBlue
extern color  marsiomaXdnSigColor = DeepPink; //Crimson

extern int    BarsToCount         = 500;

//---- buffers
//
//
//    "indexes"
//

double MABuffer1[];
double RSIBuffer1[];

//
//
//    indexes
//
//

double RSIBuffer[];
double bdn[];
double bup[];
double sdn[];
double sup[];
double marsioma[];
double marsiomaXupSig[];
double marsiomaXdnSig[];

//
//
//
//
//

int      correction;
datetime lastBarTime;
string   short_name;


//+------------------------------------------------------------------+
//| Custom indicator initialization function                         |
//+------------------------------------------------------------------+

int init()
{
   short_name = StringConcatenate("RSIOMA[",RSIOMA,"](",Ma_RSIOMA,")");
   IndicatorShortName(short_name);

   //
   //
   //
   //
   //

   SetIndexBuffer(0,RSIBuffer);
   SetIndexBuffer(2,bup);
   SetIndexBuffer(1,bdn);
   SetIndexBuffer(3,sdn);//Magneta
   SetIndexBuffer(4,sup);//DodgerBlue
   SetIndexBuffer(5,marsioma);
   SetIndexBuffer(6,marsiomaXupSig);
   SetIndexBuffer(7,marsiomaXdnSig);

      SetIndexStyle(2,DRAW_HISTOGRAM);
      SetIndexStyle(1,DRAW_HISTOGRAM);
      SetIndexStyle(3,DRAW_HISTOGRAM);
      SetIndexStyle(4,DRAW_HISTOGRAM);
      SetIndexStyle(6,DRAW_ARROW);
         SetIndexArrow(6,159);
      SetIndexStyle(7,DRAW_ARROW);
         SetIndexArrow(7,159);

   SetIndexLabel(0,"Rsioma("+RSIOMA+")");
   SetIndexLabel(5,"MaRsioma("+Ma_RSIOMA+")");
   SetIndexLabel(1,"TrendDn");
   SetIndexLabel(2,"TrendUp");
   SetIndexLabel(6,"UpXsig");
   SetIndexLabel(7,"DnXsig");


   //
   //
   //    additional buffer(s)
   //
   //


      correction  = RSIOMA+RSIOMA+Ma_RSIOMA;
      BarsToCount = MathMin(Bars,MathMax(BarsToCount,300));
          ArrayResize( MABuffer1 ,BarsToCount+correction);
          ArrayResize( RSIBuffer1,BarsToCount+correction);
          ArraySetAsSeries(MABuffer1 ,true);
          ArraySetAsSeries(RSIBuffer1,true);
                 lastBarTime = EMPTY_VALUE;

      //
      //
      //
      //
      //

   return(0);
}


//+------------------------------------------------------------------+
//|                                                                  |
//+------------------------------------------------------------------+

int start()
{
   static bool init=false;
   int    counted_bars=IndicatorCounted();
   int    limit,i=0;

   //
   //
   //
   //
   //

   if(!init) {
       init=true;
         drawLine(BuyTrigger,"BuyTrigger", BuyTriggerColor);
         drawLine(SellTrigger,"SellTrigger", SellTriggerColor );
         drawLine(MainTrendLong,"MainTrendLong", MainTrendLongColor );
         drawLine(MainTrendShort,"MainTrendShort",MainTrendShortColor );
      }

   //
   //
   //
   //
   //

   if(counted_bars<0) return(-1);
   if(lastBarTime != Time[0]) {
      lastBarTime  = Time[0];
                  counted_bars = 0;
      }
      if(counted_bars>0) counted_bars--;
              limit=Bars-counted_bars;
              limit=MathMin(limit,BarsToCount+correction);

   //
   //
   //
   //
   //

      for(i=limit;i>=0;i--)
   MABuffer1[i]  = iMA(Symbol(),0,RSIOMA,0,RSIOMA_MODE,RSIOMA_PRICE,i);
      for(i=limit;i>=0;i--)
   RSIBuffer1[i] = iRSIOnArray(MABuffer1,0,RSIOMA,i);
      for(i=limit;i>=0;i--)
      {
   RSIBuffer[i]= RSIBuffer1[i];
   marsioma[i] = iMAOnArray(RSIBuffer1,0,Ma_RSIOMA,0,Ma_RSIOMA_MODE,i);

         //
         //
         //
         //
         //

            bup[i] = EMPTY_VALUE; bdn[i] = EMPTY_VALUE;
            sup[i] = EMPTY_VALUE; sdn[i] = EMPTY_VALUE;

               if(RSIBuffer[i] > 50)               bup[i] =   6;
               if(RSIBuffer[i] < 50)               bdn[i] =  -6;
               if(RSIBuffer[i] > MainTrendLong)    bup[i] =  12;
               if(RSIBuffer[i] < MainTrendShort)   bdn[i] = -12;

               if(RSIBuffer[i]<20 && RSIBuffer[i]>RSIBuffer[i+1])                sup[i] =  -3;
               if(RSIBuffer[i]>80 && RSIBuffer[i]<RSIBuffer[i+1])                sdn[i] =   4;
               if(RSIBuffer[i]>20 && RSIBuffer[i+1]<=20)                         sup[i] =   5;
               if(RSIBuffer[i+1]>=80 && RSIBuffer[i]<80)                         sdn[i] =  -5;
               if(RSIBuffer[i+1]<=MainTrendShort && RSIBuffer[i]>MainTrendShort) sup[i] =  12;
               if(RSIBuffer[i]<MainTrendLong && RSIBuffer[i+1]>=MainTrendLong)   sdn[i] = -12;

            marsiomaXupSig[i] = EMPTY_VALUE;
            marsiomaXdnSig[i] = EMPTY_VALUE;

               if(RSIBuffer[i+1]<=marsioma[i+1]&&RSIBuffer[i]>marsioma[i]) marsiomaXupSig[i] = -11;
               if(RSIBuffer[i+1]>=marsioma[i+1]&&RSIBuffer[i]<marsioma[i]) marsiomaXdnSig[i] =  11;
   }

   //
   //
   //
   //
   //

   for (i=0;i<indicator_buffers;i++) SetIndexDrawBegin(i,Bars-BarsToCount);
   return(0);
}


//+------------------------------------------------------------------+
//|                                                                  |
//+------------------------------------------------------------------+

void drawLine(double lvl,string name, color Col )
{
   ObjectDelete(name);
   ObjectCreate(name, OBJ_HLINE, WindowFind(short_name), Time[0], lvl,Time[0], lvl);
   ObjectSet(name   , OBJPROP_STYLE, STYLE_DOT);
   ObjectSet(name   , OBJPROP_COLOR, Col);
   ObjectSet(name   , OBJPROP_WIDTH, 1);
}
Comments