RZI
Download script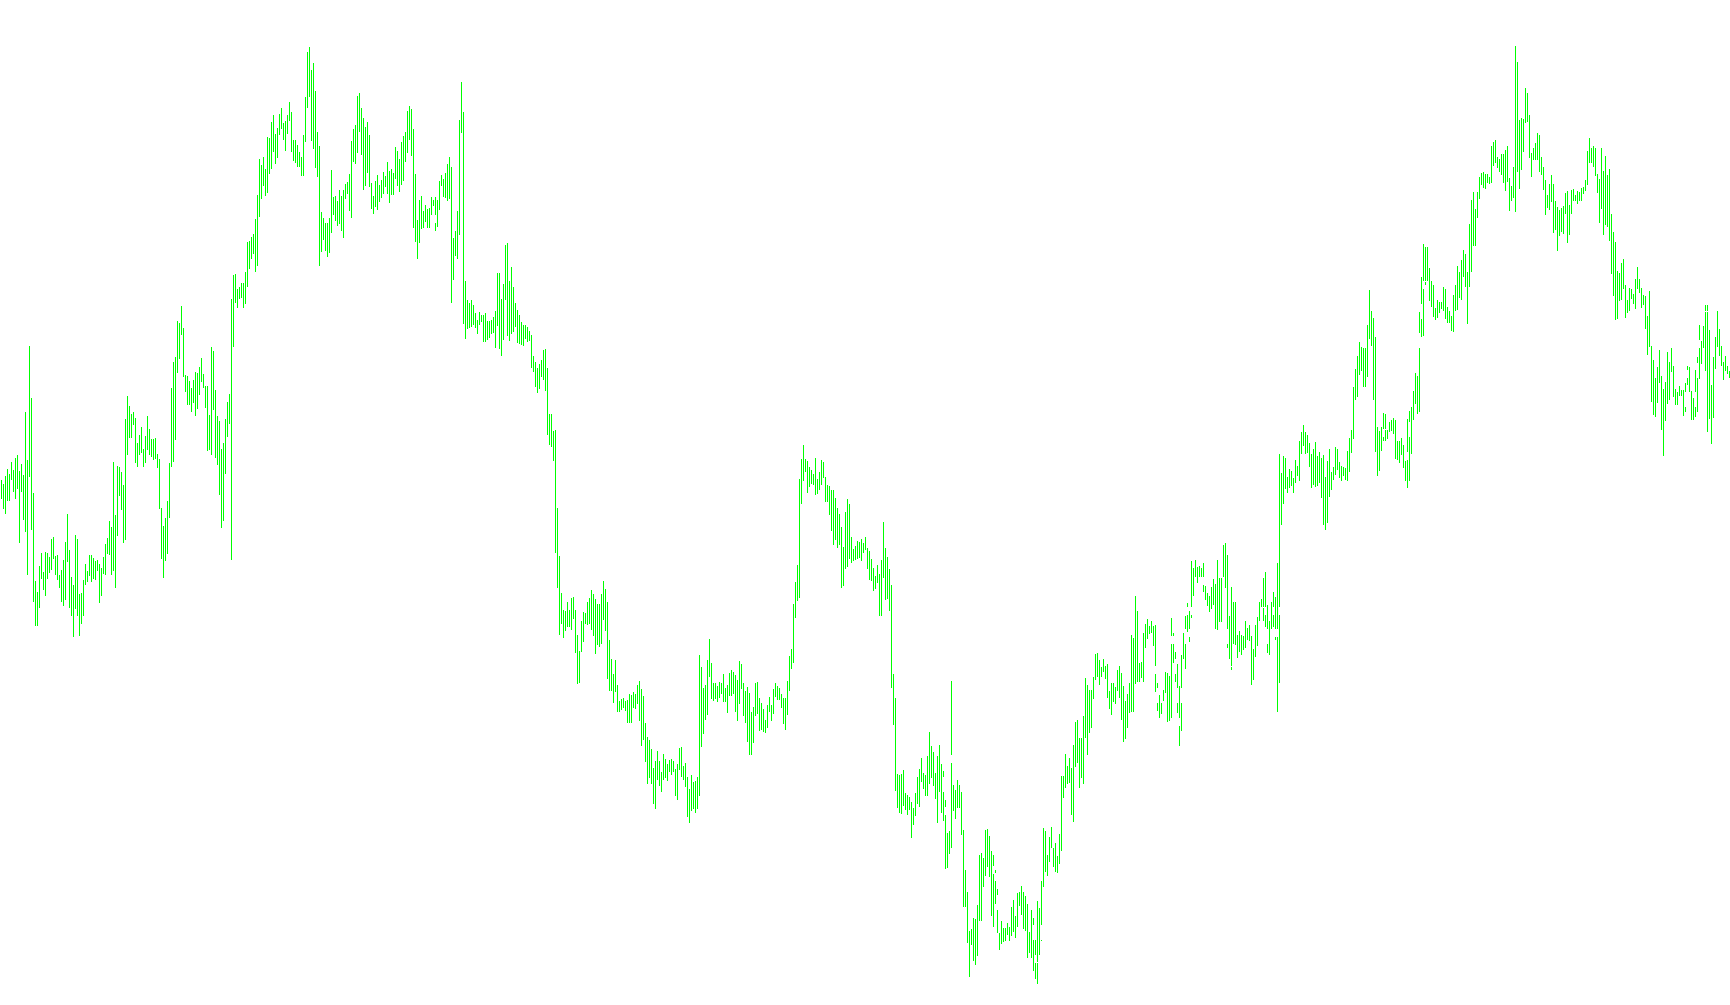
This tool is designed to provide a visual representation of market momentum by tracking the progression of price highs and lows over time. Instead of focusing on complex mathematical formulas, it looks at the structural "growth" or "contraction" of the price action candle by candle.
How the Logic Works
The script monitors the relationship between the current price candle and the one immediately preceding it. It evaluates two specific conditions to determine how to move the indicator line:
1. Upward Progression (Bullish Strength) If a candle shows both a higher high and a higher low than the previous candle, the tool recognizes this as a positive movement in momentum. When this happens, the indicator increases its value by one unit. This creates an upward step on the chart, signifying that the market is expanding in a bullish direction.
2. Downward Progression (Bearish Strength) Conversely, if a candle shows both a lower high and a lower low than the previous candle, the tool identifies this as a negative movement. In these instances, the indicator decreases its value by one unit. This creates a downward step, highlighting an expansion in a bearish direction.
3. Neutrality (Consolidation) If neither of the above conditions is met—for example, if the price is moving sideways or if the high/low are mixed compared to the previous candle—the indicator remains unchanged. In these cases, the line stays flat, indicating a period of consolidation where there is no clear directional breakout.
Summary for the Trader
Essentially, this script acts as a "momentum counter." By looking at the resulting line in the separate window:
- Rising Steps: Show a consistent trend where prices are making higher peaks and higher valleys.
- Falling Steps: Show a consistent trend where prices are making lower peaks and lower valleys.
- Flat Sections: Show periods of uncertainty or "choppiness" where the price is not clearly trending in one direction.
The visual result is a clean, step-like progression that helps you identify whether the current market structure is structurally expanding upwards, downwards, or remaining stagnant.
//+------------------------------------------------------------------+
//|                                                        RZI:).mq4 |
//|                                   Copyright © 1895, Prosto_Daun. |
//|                                              http://www.p_sec.eu |
//+------------------------------------------------------------------+
#property  copyright "Vasya_Daun © Corp"
#property  link      "http://www.p_sec.eu"
//---- indicator settings
#property indicator_separate_window
#property indicator_buffers 1
#property indicator_color1 Black

//---- buffers
double ExtMapBuffer1[];

//----
int ExtCountedBars=0;

//+------------------------------------------------------------------+
//| Custom indicator initialization function                         |
//+------------------------------------------------------------------+
int init()
  {
//---- indicators
   SetIndexStyle(0,DRAW_LINE,0,1,Black);
   SetIndexBuffer(0,ExtMapBuffer1);


//---- initialization done
   return(0);
  }
//+------------------------------------------------------------------+
//| Custor indicator deinitialization function                       |
//+------------------------------------------------------------------+
int deinit()
  {
//---- TODO: add your code here

//----
   return(0);
  }
//+------------------------------------------------------------------+
//| Custom indicator iteration function                              |
//+------------------------------------------------------------------+
int start()
  {
   if(Bars<=10) return(0);
   ExtCountedBars=IndicatorCounted();
//---- check for barsible errors
   if (ExtCountedBars<0) return(-1);
//---- last counted bar will be recounted
   if (ExtCountedBars>0) ExtCountedBars--;
   int bar=Bars-ExtCountedBars-1;

   while(bar>=0)
     {

   	if (High [bar] > High [bar+1] && Low [bar]> Low [bar+1])// 1
   	  	{
         ExtMapBuffer1[bar]=1+ExtMapBuffer1[bar+1];


         }
      else
         {
            if (High[bar]<High[bar+1] && Low[bar]< Low[bar+1])// -1
	     	     {
               ExtMapBuffer1[bar]=ExtMapBuffer1[bar+1]-1;


	  	        }
            else
            {
               ExtMapBuffer1[bar]=ExtMapBuffer1[bar+1];

            }
          }


 	   bar--;
     }

   return(0);
  }
Comments