s Indicator [i]_v1
Download script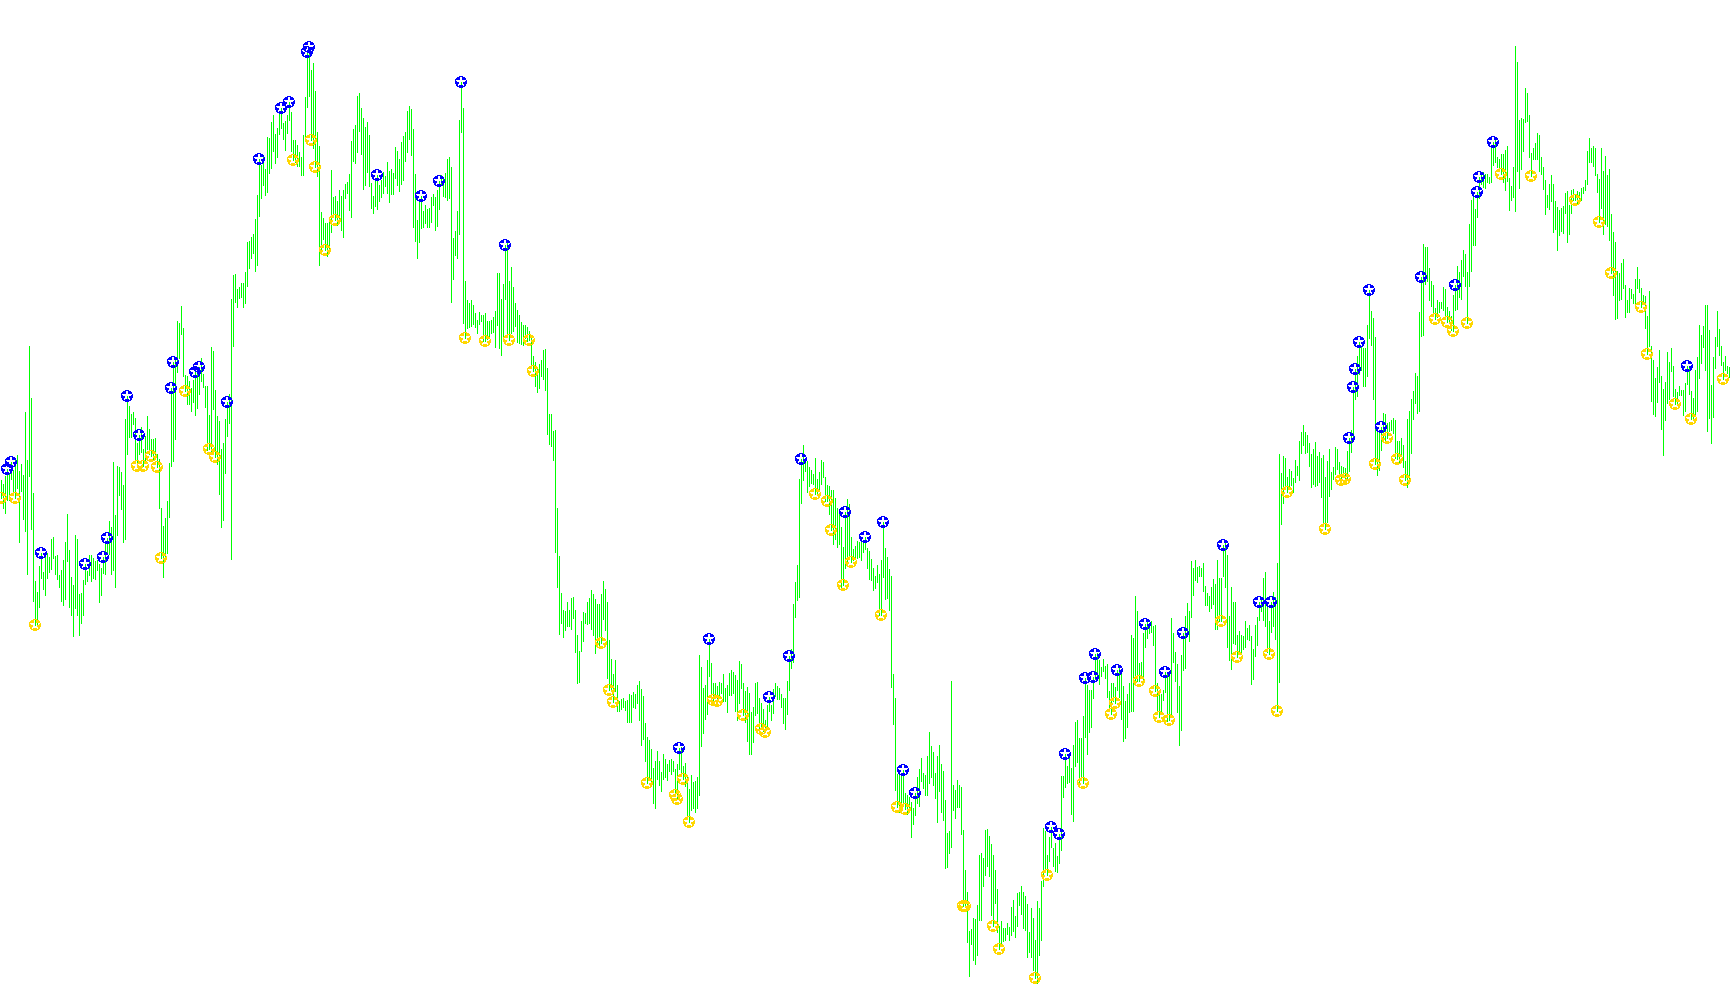
This specialized trading indicator is designed to identify specific price action patterns on a chart to help traders spot potential entry points. It operates using two distinct logic modes, allowing the user to switch between different market philosophies depending on their preferred strategy.
Core Methodology
The tool analyzes the relationship between previous price candles and current price movement. It specifically looks at "ranges"—the distance between the highest and lowest price reached during a specific time period—and calculates key zones within those ranges (the top 20% and bottom 20%).
Trading Variations
Variation 0: Momentum Reversal In this mode, the script looks for significant price exhaustion or "over-extensions" from the previous candle:
- Buy Signals: These are triggered if the previous candle opened near its peak but finished near its bottom. The indicator suggests looking for a buy opportunity when the current price drops slightly below the previous candle's low.
- Sell Signals: These occur when the previous candle opened near its base but finished near its peak. The indicator suggests a sell opportunity when the current price rises slightly above the previous candle's high.
Variation 1: Volatility Contraction (Inside Bar) This mode focuses on "consolidation" or a "coiling" effect in the market. It looks for a specific setup where the market becomes momentarily quiet:
- The Setup: The script identifies a "contraction" by checking if the previous candle is an "inside bar" (smaller than the three candles preceding it). This often suggests that price movement is pausing before a breakout.
- Buy Signals: If this contraction occurs, a buy signal is generated if the current price opens in the lower 20% zone of the previous candle's range.
- Sell Signals: A sell signal is generated if the current price opens in the upper 20% zone of the previous candle's range.
Visual Representation
The indicator provides immediate visual feedback on the chart by placing specific markers (arrows) at the calculated price levels. This allows a trader to quickly see where the mathematical conditions for a "Buy" or "Sell" have been met without having to manually calculate percentages or historical ranges.
//+------------------------------------------------------------------+
//|                                                   The 20's v0.20 |
//+------------------------------------------------------------------+
#property copyright "Copyright © 2005, TraderSeven"
#property link      "TraderSeven@gmx.net"

// This EA has 2 main parts.
// Variation=0
// If previous bar opens in the lower 20% of its range and closes in the upper 20% of its range then sell on previous high+10pips.
// If previous bar opens in the upper 20% of its range and closes in the lower 20% of its range then buy on previous low-10pips.

// Variation=1
// The previous bar is an inside bar that has a smaller range than the 3 bars before it.
// If todays bar opens in the lower 20% of yesterdays range then buy.
// If todays bar opens in the upper 20% of yesterdays range then sell.

#property indicator_chart_window
#property indicator_buffers 2
#property indicator_color1 Blue
#property indicator_color2 Red
//----
extern int Variation=0;
//----
double The20sBufferBuy[];
double The20sBufferSell[];
//+------------------------------------------------------------------+
//|                                                                  |
//+------------------------------------------------------------------+
int init()
  {
   IndicatorBuffers(2);
   SetIndexStyle(0,DRAW_ARROW);
   SetIndexStyle(1,DRAW_ARROW);
   SetIndexBuffer(0,The20sBufferBuy);
   SetIndexBuffer(1,The20sBufferSell);
   SetIndexArrow(0,181);
   SetIndexArrow(1,181);
   SetIndexEmptyValue(0,0.0);
   SetIndexEmptyValue(1,0.0);
   ArraySetAsSeries(The20sBufferBuy,true);
   ArraySetAsSeries(The20sBufferSell,true);
   IndicatorShortName("The20s("+Variation+")");
   return(0);
  }
//+------------------------------------------------------------------+
//|                                                                  |
//+------------------------------------------------------------------+
int deinit()
  {
   return(0);
  }
//+------------------------------------------------------------------+
//|                                                                  |
//+------------------------------------------------------------------+
int start()
  {
   int i,TotalBars, CountedBars;
   double LastBarsRange,Top20,Bottom20;
   CountedBars=IndicatorCounted();     // Find the number of bars on the screen since
   //    this indicator/expert was first executed
   //    on the current chart
   if(CountedBars < 0)                 // If there are less than 0 bars of data, we
      return(-1);                     //    have a problem
   if(CountedBars > 0)
      CountedBars--;
//----
   TotalBars=Bars-CountedBars;
   for(i=TotalBars-1;i>=0;i--)
     {
      LastBarsRange=(High[i+1]-Low[i+1]);
      Top20=High[i+1]-(LastBarsRange*0.20);
      Bottom20=Low[i+1]+(LastBarsRange*0.20);
      if(Variation==0)
        {
         if(Open[i+1]>=Top20 && Close[i+1]<=Bottom20 && Low[i]<=Low[i+1]+10*Point)
            The20sBufferBuy[i]=Low[i];
         else if(Open[i+1]<=Bottom20 && Close[i+1]>=Top20 && High[i]>=High[i+1]+10*Point)
               The20sBufferSell[i]=High[i];
        }
      else if(Variation==1)
           {
            if((High[i+4]-Low[i+4])>LastBarsRange && (High[i+3]-Low[i+3])>LastBarsRange && (High[i+2]-Low[i+2])>LastBarsRange && High[i+2]>High[i+1] && Low[i+2]<Low[i+1])
              {
               if(Open[i]<=Bottom20)
                  The20sBufferBuy[i]=Low[i];
               if(Open[i]>=Top20)
                  The20sBufferSell[i]=High[i];
              }
           }
     }
  }
//+------------------------------------------------------------------+
Comments