sa#MTEI_Supertrend
Download script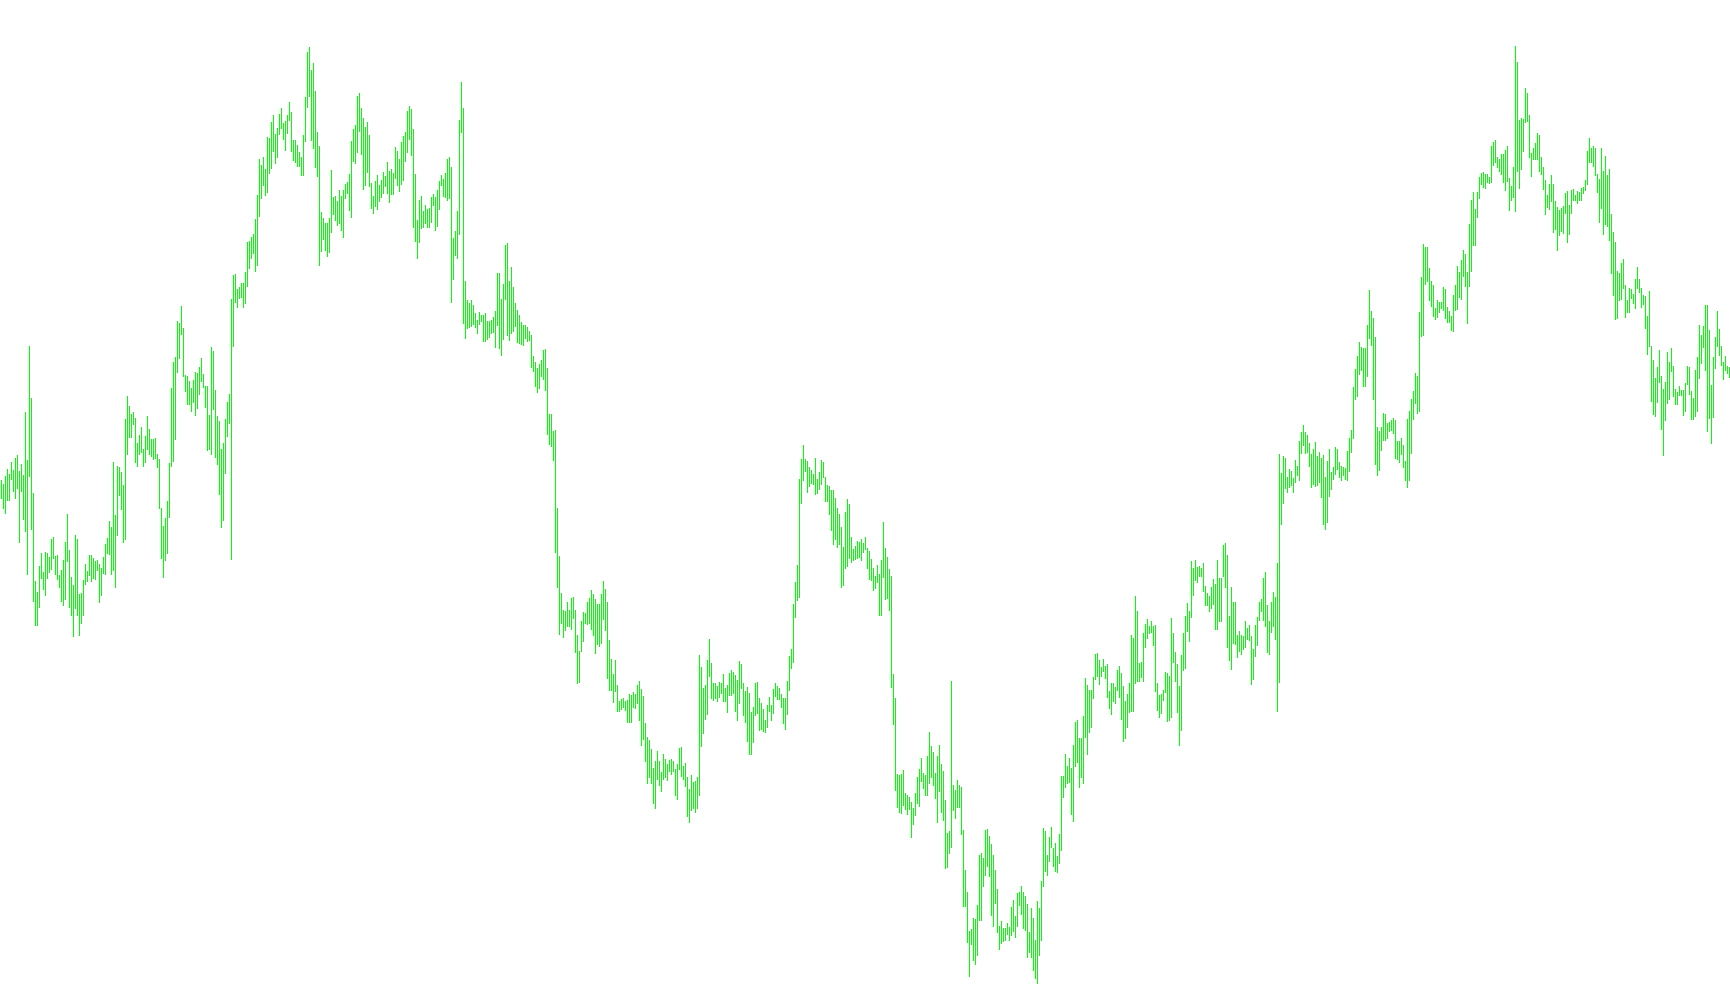
This technical tool is designed to identify and visualize market trends by blending two distinct types of market analysis: momentum and volatility. Rather than relying on a single price movement, it uses a multi-layered logic to determine when the market is shifting direction.
Core Logic Overview
The script operates by monitoring three primary data points to create a "trend following" visual on your chart:
1. Momentum Filtering (CCI) The tool utilizes the Commodity Channel Index (CCI) to establish the general "mood" of the market. By comparing the current momentum against a specific threshold, the script decides whether the price action is leaning toward an upward or downward bias. It specifically looks for "crossovers"—moments where the momentum shifts from one side of the baseline to the other—to signal a potential change in trend direction.
2. Volatility Measurement (ATR) To ensure that trend lines are not just reacting to minor price "noise," the script incorporates the Average True Range (ATR). This measures the current market volatility. The tool uses this data to calculate a dynamic buffer zone around the price, ensuring that the trend lines remain smooth and aren't overly sensitive to insignificant fluctuations.
3. Trend Smoothing and Calculation The script calculates two distinct lines: one for upward trends and one for downward trends.
- In an Upward Trend: It looks at the recent price lows and subtracts a volatility buffer to create a support-style line.
- In a Downward Trend: It looks at the recent price highs and adds a volatility buffer to create a resistance-style line.
A key feature of this logic is its "memory." The script ensures that these trend lines only move in one direction (they do not "flip" back easily). For example, in an uptrend, the line will only move higher or stay flat; it won't drop until the momentum filter confirms a definitive shift to the downside.
Summary of Behavior
For a trader, this means the tool acts as a visual guide for price action. It filters out market "chatter" by requiring both a momentum shift (CCI) and a volatility-adjusted price movement before changing the trend line's color or direction. It effectively helps identify whether the current market state is one of sustained growth or steady decline, providing a cleaner view of the market than raw price data alone.
//+------------------------------------------------------------------------+
//|                                                 sa#MTEI_Supertrend.mq4 |
//|http://finance.groups.yahoo.com/group/MetaTrader_Experts_and_Indicators/|
//+------------------------------------------------------------------------+
#property copyright ""
#property link      "http://finance.groups.yahoo.com/group/MetaTrader_Experts_and_Indicators/"

#property indicator_chart_window
#property indicator_buffers 2
#property indicator_color1 Lime
#property indicator_color2 Red
extern double CCI_Period=50;
extern double ATR_Period=5;

double TrendUp[];
double TrendDown[];
int st = 0;
//extern int SlowerEMA = 6;


//+------------------------------------------------------------------+
//| Custom indicator initialization function|
//+------------------------------------------------------------------+
int init()
 {
//---- indicators

  SetIndexStyle(0, DRAW_LINE, STYLE_SOLID, 2);
  SetIndexBuffer(0, TrendUp);
  SetIndexStyle(1, DRAW_LINE, STYLE_SOLID, 2);
  SetIndexBuffer(1, TrendDown);

  /*SetIndexStyle(0, DRAW_ARROW, EMPTY);
  SetIndexArrow(0, 159);
  SetIndexBuffer(0, TrendUp);
  SetIndexStyle(1, DRAW_ARROW, EMPTY);
  SetIndexArrow(1, 159);
  SetIndexBuffer(1, TrendDown);*/

  /*for(int i = 0; i < Bars; i++) {
     TrendUp[i] = NULL;
     TrendDown[i] = NULL;
  }*/
//----
  return(0);
 }
//+------------------------------------------------------------------+
//| Custor indicator deinitialization function|
//+------------------------------------------------------------------+
int deinit()
 {
//----
  /*for(int i = 0; i < Bars; i++) {
     TrendUp[i] = NULL;
     TrendDown[i] = NULL;
  }*/
//----
  return(0);
 }
//+------------------------------------------------------------------+
//| Custom indicator iteration function|
//+------------------------------------------------------------------+
int start()
 {

  int limit, i, counter;
  double Range, AvgRange, cciTrendNow, cciTrendPrevious, var;

  int counted_bars = IndicatorCounted();
//---- check for possible errors
  if(counted_bars < 0) return(-1);
//---- last counted bar will be recounted
  if(counted_bars > 0) counted_bars--;

  limit=Bars-counted_bars;

  for(i = limit; i >= 0; i--) {
     cciTrendNow = iCCI(NULL, 0, CCI_Period, PRICE_TYPICAL, i);
     cciTrendPrevious = iCCI(NULL, 0, CCI_Period, PRICE_TYPICAL, i+1);

     //st = st * 100;


     counter = i;
     Range = 0;
     AvgRange = 0;
     for (counter = i; counter >= i-9; counter--) {
        AvgRange = AvgRange + MathAbs(High[counter]-Low[counter]);
     }
     Range = AvgRange/10;
     if (cciTrendNow >= st && cciTrendPrevious < st) {
        TrendUp[i+1] = TrendDown[i+1];
     }

     if (cciTrendNow <= st && cciTrendPrevious > st) {
        TrendDown[i+1] = TrendUp[i+1];
     }

     if (cciTrendNow >= st) {
        TrendUp[i] = Low[i] - iATR(NULL, 0, ATR_Period, i);
        if (TrendUp[i] < TrendUp[i+1]) {
           TrendUp[i] = TrendUp[i+1];
        }
     }
     else if (cciTrendNow <= st) {
        TrendDown[i] = High[i] + iATR(NULL, 0, ATR_Period, i);
        if (TrendDown[i] > TrendDown[i+1]) {
           TrendDown[i] = TrendDown[i+1];
        }
     }
  }

//----

//----
  return(0);
 }

//+------------------------------------------------------------------+
Comments