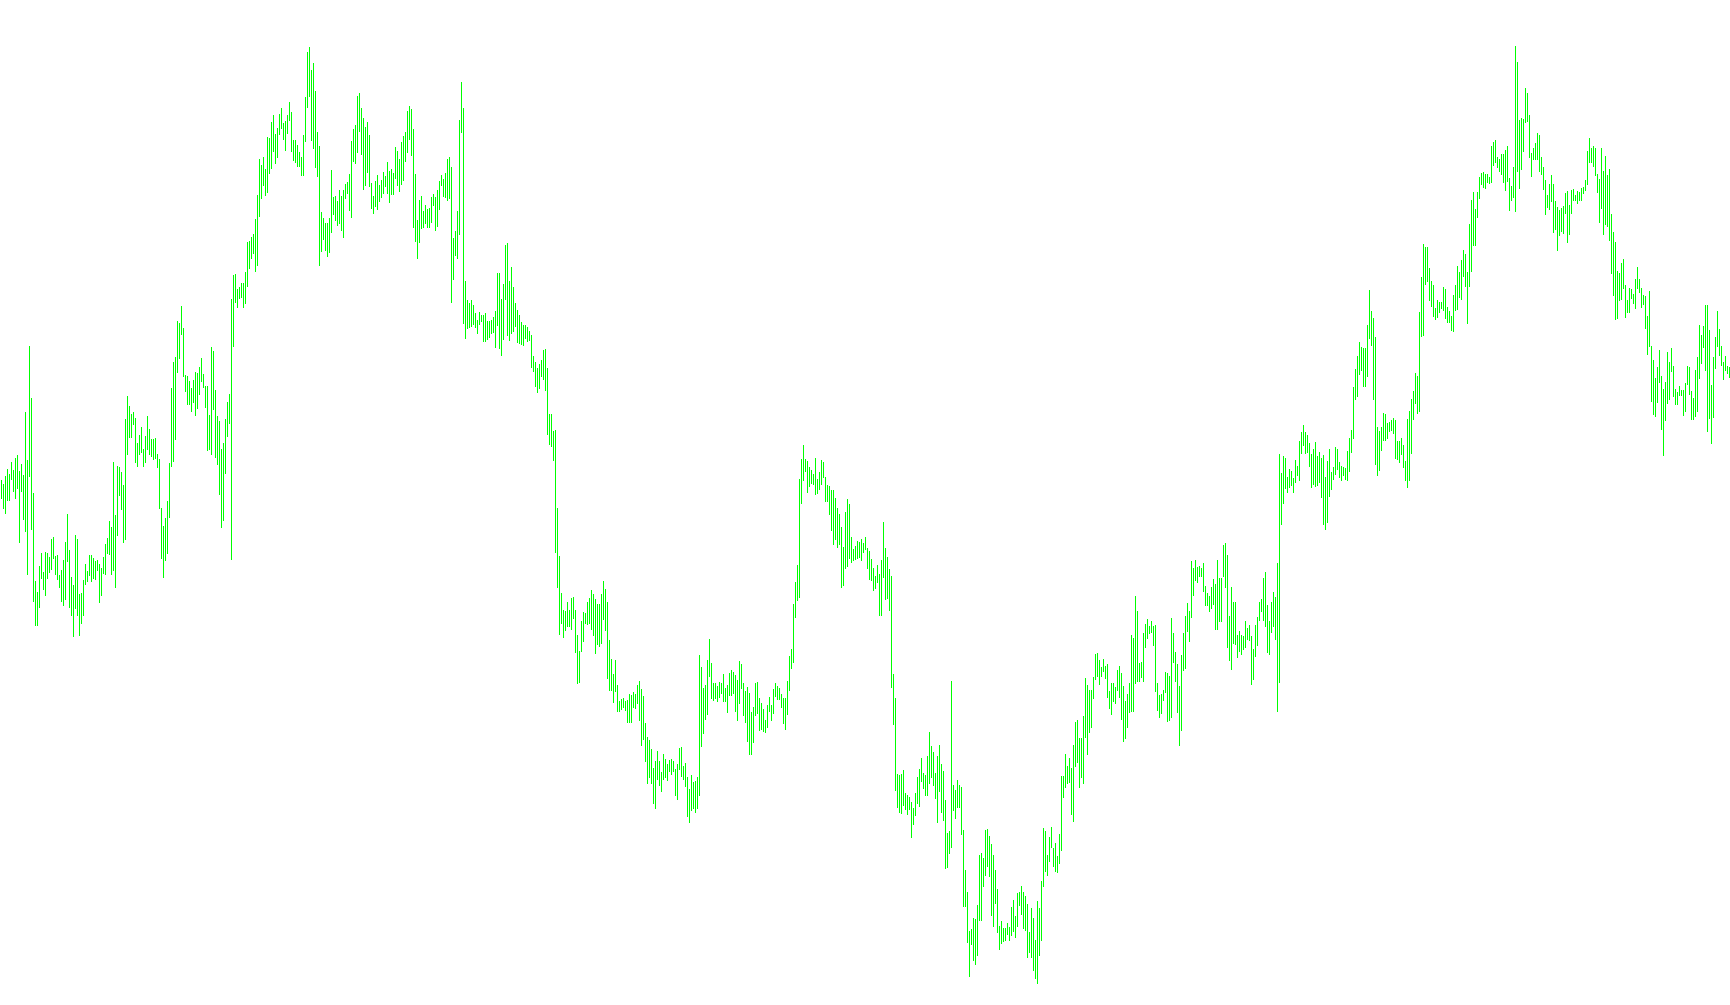
This indicator is designed to provide a smoothed visual representation of price action on a trading chart. Instead of simply plotting the raw, jagged movements of the market, it uses a sophisticated mathematical approach to filter out "noise" and highlight the underlying trend.
How the Logic Works
1. Multi-Point Historical Analysis The script analyzes a specific window of historical data—specifically looking back at the last 65 price points (closing prices). By considering this wide range of previous prices simultaneously, the indicator creates a more comprehensive "picture" of where the market is headed rather than reacting impulsively to the very last tick.
2. Weighted Calculation The core of the logic lies in its weighting system. Not every price point in that 65-bar window is treated with equal importance. The script applies unique mathematical coefficients (multipliers) to each specific historical price:
- Recent Influence: The most immediate recent prices are given significant positive weights, ensuring the indicator remains responsive to current market momentum.
- Balanced Smoothing: As the logic looks further back into the past, the weights decrease significantly. This prevents old data from skewing the current reading too much while still providing a "buffer" that smooths out minor fluctuations.
- Dynamic Offsetting: The formula includes specific negative and positive adjustments at various intervals within the lookback period. These act as stabilizers, helping to neutralize outliers and ensure the resulting line represents a fluid trend rather than erratic spikes.
3. Visual Output The final result of these combined calculations is a single, continuous yellow line drawn on your chart window. Because it aggregates 65 different points of data into one calculated value at every step, the resulting line appears much smoother than the actual price candles.
Summary for the User
Think of this indicator as a "trend filter." It looks at a large neighborhood of recent price history, calculates a weighted average based on specific mathematical importance, and translates that complexity into a simple, easy-to-read yellow line. This helps traders identify the general direction of the market by stripping away the distracting "flickers" of short-term volatility.
//+------------------------------------------------------------------+
//| SATL.mq4
//|
//+------------------------------------------------------------------+
#property copyright "Copyright 2002, Finware.ru Ltd."
#property link "http://www.finware.ru/"

#property indicator_chart_window
#property indicator_buffers 1
#property indicator_color1 Yellow


//---- buffers
double SATLBuffer[];
//+------------------------------------------------------------------+
//| Custom indicator initialization function |
//+------------------------------------------------------------------+
int init()
{
string short_name;
//---- indicator line
SetIndexStyle(0,DRAW_LINE);
SetIndexBuffer(0,SATLBuffer);
SetIndexDrawBegin(0,64);
//----
return(0);
}
//+------------------------------------------------------------------+
//| SATL |
//+------------------------------------------------------------------+
int start()
{
int i,counted_bars=IndicatorCounted();
//----
if(Bars<=64) return(0);
//---- initial zero
if(counted_bars<64)
for(i=1;i<=0;i++) SATLBuffer[Bars-i]=0.0;
//----
i=Bars-64-1;
if(counted_bars>=64) i=Bars-counted_bars-1;
while(i>=0)
{
SATLBuffer[i]=
0.0982862174*Close[i+0]
+0.0975682269*Close[i+1]
+0.0961401078*Close[i+2]
+0.0940230544*Close[i+3]
+0.0912437090*Close[i+4]
+0.0878391006*Close[i+5]
+0.0838544303*Close[i+6]
+0.0793406350*Close[i+7]
+0.0743569346*Close[i+8]
+0.0689666682*Close[i+9]
+0.0632381578*Close[i+10]
+0.0572428925*Close[i+11]
+0.0510534242*Close[i+12]
+0.0447468229*Close[i+13]
+0.0383959950*Close[i+14]
+0.0320735368*Close[i+15]
+0.0258537721*Close[i+16]
+0.0198005183*Close[i+17]
+0.0139807863*Close[i+18]
+0.0084512448*Close[i+19]
+0.0032639979*Close[i+20]
-0.0015350359*Close[i+21]
-0.0059060082*Close[i+22]
-0.0098190256*Close[i+23]
-0.0132507215*Close[i+24]
-0.0161875265*Close[i+25]
-0.0186164872*Close[i+26]
-0.0205446727*Close[i+27]
-0.0219739146*Close[i+28]
-0.0229204861*Close[i+29]
-0.0234080863*Close[i+30]
-0.0234566315*Close[i+31]
-0.0231017777*Close[i+32]
-0.0223796900*Close[i+33]
-0.0213300463*Close[i+34]
-0.0199924534*Close[i+35]
-0.0184126992*Close[i+36]
-0.0166377699*Close[i+37]
-0.0147139428*Close[i+38]
-0.0126796776*Close[i+39]
-0.0105938331*Close[i+40]
-0.0084736770*Close[i+41]
-0.0063841850*Close[i+42]
-0.0043466731*Close[i+43]
-0.0023956944*Close[i+44]
-0.0005535180*Close[i+45]
+0.0011421469*Close[i+46]
+0.0026845693*Close[i+47]
+0.0040471369*Close[i+48]
+0.0052380201*Close[i+49]
+0.0062194591*Close[i+50]
+0.0070340085*Close[i+51]
+0.0076266453*Close[i+52]
+0.0080376628*Close[i+53]
+0.0083037666*Close[i+54]
+0.0083694798*Close[i+55]
+0.0082901022*Close[i+56]
+0.0080741359*Close[i+57]
+0.0077543820*Close[i+58]
+0.0073260526*Close[i+59]
+0.0068163569*Close[i+60]
+0.0062325477*Close[i+61]
+0.0056078229*Close[i+62]
+0.0049516078*Close[i+63]
+0.0161380976*Close[i+64];


i--;
}
return(0);
}
//+------------------------------------------------------------------+
Comments