SayaBarCrossView
Download script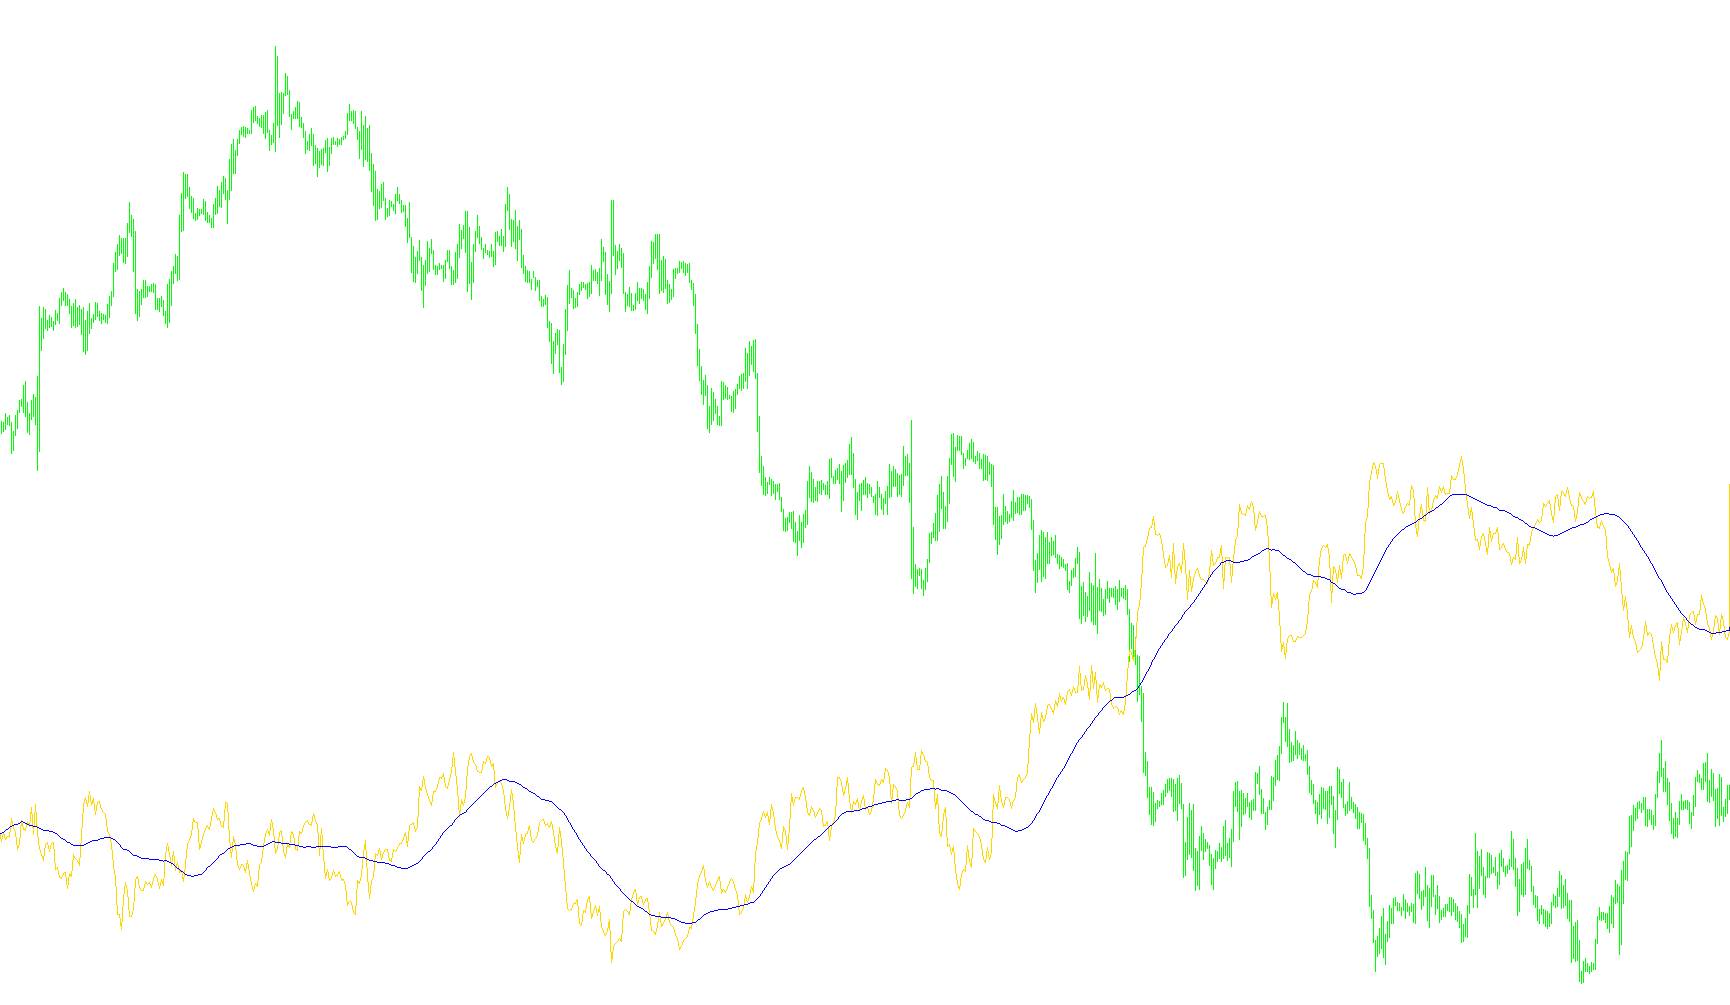
This tool is designed to help traders visualize specific price behaviors by analyzing the relationship between two different currency pairs. Instead of looking at a single market, it identifies discrepancies in how prices are moving across different assets to highlight potential opportunities.
How it Works
The logic operates through a three-step process to simplify complex market data into a readable visual format:
1. Cross-Currency Comparison The script takes the current price of the asset you are currently trading and compares it against the price of a second, user-defined currency pair (for example, comparing one pair against the Japanese Yen). It looks at how these prices differ from one another in real-time.
2. Calculating the Variance Rather than showing you raw numbers, the script calculates the "gap" or distance between these two markets. It converts the prices into a standardized format so that they can be compared accurately regardless of their original value. The result is a numerical representation of how much these two markets are diverging or converging at any given moment.
3. Smoothing the Data (The Moving Average) Because market data can be very "noisy" and jump around rapidly, the script applies a smoothing filter to this variance. This creates a flowing line (a Moving Average) that highlights the broader trend of the price gap. This allows you to ignore minor fluctuations and focus on the more significant, sustained movements between the two currencies.
Visual Representation
The indicator appears in its own separate window on your chart. It provides two distinct lines:
- The Primary Data Line: Shows the immediate, raw difference between the two markets.
- The Smoothed Trend Line: Shows the average movement of that difference over a specific period, helping you identify whether the gap is widening or narrowing in a meaningful way.
By observing these lines, traders can better understand the underlying tension between different currency pairs and identify moments where the market might be reacting to external pressures.
//+------------------------------------------------------------------+
//|                                             SayaBarCrossView.mq4 |
//|                                     Copyright 2011 Masaru.Sasaki |
//|                                      http://youtarou.blogzine.jp |
//+------------------------------------------------------------------+
#property copyright "Copyright 2011 Masaru.Sasaki"
#property link      "http://youtarou.blogzine.jp"

#property indicator_separate_window
#property indicator_buffers 2
#property indicator_color1 Red
#property indicator_color2 Yellow
#property indicator_level1 0

// parameters
extern string SetCurrency = "CHFJPY"; // AUDJPY default
extern int Ma_mode = MODE_SMA;
extern int SmoothMa = 43;

// buffers
double Sayabuf[];
double SayaMabuf[];

//+------------------------------------------------------------------+
//| Custom indicator initialization function                         |
//+------------------------------------------------------------------+
int init()
{
   // Symbol check
   if( StringLen(Symbol()) > 6 )
   {
      SetCurrency = SetCurrency+StringSubstr(Symbol(),6, StringLen(Symbol())-6);
   }

   SetIndexBuffer(0, Sayabuf);
   SetIndexBuffer(1, SayaMabuf);

   SetIndexLabel(0,SetCurrency+"[Saya]");
   SetIndexLabel(1,SetCurrency+"[SayaMA]");

   return(0);
}
//+------------------------------------------------------------------+
//| Custom indicator deinitialization function                       |
//+------------------------------------------------------------------+
int deinit()
{

   return(0);
}
//+------------------------------------------------------------------+
//| Custom indicator iteration function                              |
//+------------------------------------------------------------------+
int start()
  {
   int    counted_bars=IndicatorCounted();
   int limit=Bars-counted_bars;

   for(int i=limit-1; i>=0; i--)
   {
      Sayabuf[i] = MathAbs((Close[i]/Point)-(iClose(SetCurrency,0,i)/MarketInfo(SetCurrency,MODE_TICKSIZE)));
   }

   // Saya MA
   for(i=0; i<limit; i++)
   {
      SayaMabuf[i] = iMAOnArray(Sayabuf, Bars, SmoothMa, 0, Ma_mode, i);
   }
   return(0);
  }
//+------------------------------------------------------------------+
Comments