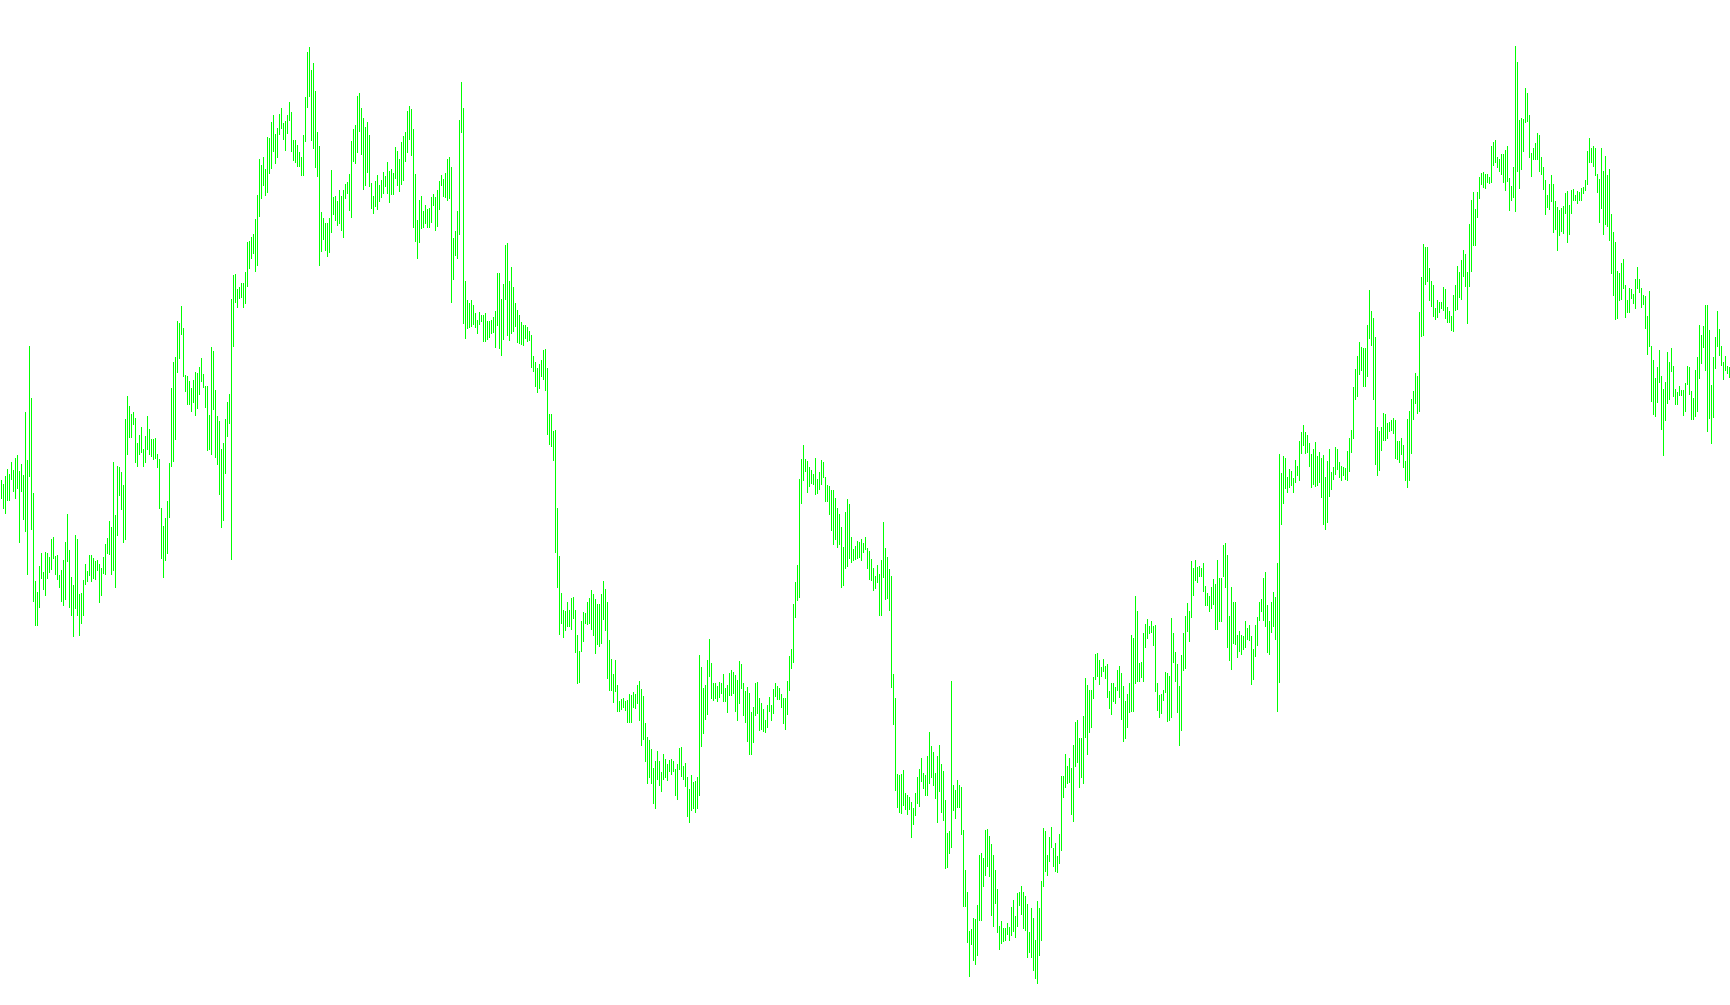
This script is designed to visualize the "Schaff Trend Cycle" on a trading platform, providing a smoothed representation of market momentum. Rather than showing raw price action, it focuses on the relationship between different moving averages to help identify trends and potential turning points.
Core Logic Overview
The indicator works by analyzing the distance between two different types of moving averages: a short-term average (which reacts quickly to recent price changes) and a long-term average (which represents the broader trend). By calculating the difference between these two, the script identifies the current "strength" or momentum of the market.
How the Calculation Works
To provide a clean, readable signal, the script processes this data through several distinct stages:
- Momentum Tracking: It first calculates a "MACD-style" value—the simple difference between the short-term and long-term moving averages.
- Cyclical Analysis: The logic groups these differences into specific "cycles." Within each cycle, it identifies the highest and lowest momentum points reached.
- Relative Positioning: It then calculates where the current momentum sits relative to those high and low points as a percentage. This essentially tells the script: "Where are we in the current move?" (e.g., Is momentum currently peaking, bottoming out, or somewhere in between?)
- Smoothing Mechanism: Because raw momentum can be erratic and "noisy," the script applies a specific smoothing constant. This ensures that the final line on your chart moves fluidly rather than jumping erratically, making it easier to see the overall trajectory of the trend.
Visual Representation
The result is a single line displayed in a separate window below the main price chart.
- Trend Direction: When the line moves upward, it suggests increasing bullish momentum; moving downward suggests bearish momentum.
- Reference Levels: The indicator includes preset levels (20 and 80). These act as benchmarks to help you see when momentum is reaching extreme highs or lows, which can often signal that a trend is becoming overextended.
In summary, this tool converts complex price fluctuations into a smoothed cycle, allowing you to visualize the "rhythm" of the market's momentum more clearly than by looking at price alone.
//+------------------------------------------------------------------+
//|                                          Schaff Trend Cycle.mq4  |
//|                                       Ramdass - Conversion only  |
//+------------------------------------------------------------------+
#property  copyright "Copyright © 2004, FostarFX."
#property  link      "mail: fostar_fx@yahoo.com"

#property indicator_separate_window
#property indicator_minimum -10
#property indicator_maximum 110
#property indicator_buffers 1
#property indicator_color1 DarkOrchid

#property indicator_level2 20
#property indicator_level3 80

//---- input parameters
extern int MAShort=12;
extern int MALong=50;
extern double Cycle=10;
extern int CountBars=300;
extern double sm = 2;

//---- buffers
double MA[];

//+------------------------------------------------------------------+
//| Custom indicator initialization function                         |
//+------------------------------------------------------------------+
int init()
  {
//   string short_name;
//---- indicator line
   SetIndexBuffer(0, MA);
   SetIndexStyle(0,DRAW_LINE,STYLE_SOLID,2,DarkOrchid);

//----
//----
   return(0);
  }

//+------------------------------------------------------------------+
//| Custor indicator deinitialization function                       |
//+------------------------------------------------------------------+
int deinit()
  {
//---- TODO: add your code here
//----
   return(0);
}


//+------------------------------------------------------------------+
//| Schaff Trend Cycle                                               |
//+------------------------------------------------------------------+
int start()
  {
   SetIndexDrawBegin(0,Bars-CountBars+MALong+MAShort+1);
   int shift,u,counted_bars=IndicatorCounted();
   double ST, MCD, LLV, HHV, MA_Short, MA_Long, sum ,prev, smconst;
   int n, i, s;
   bool check_begin=false, check_begin_MA=false;
   double MCD_Arr[100];

   if(Bars<=MALong) return(0);
 if (CountBars==0) CountBars=Bars;
//---- initial zero
   if(counted_bars<MALong+MAShort)
   {
      for(i=1;i<=MALong;i++) MA[Bars-i]=0.0;
   }
//----
   shift=CountBars-MALong-1;
//   if(counted_bars>=MALong) shift=Bars-counted_bars-1;

   check_begin = false;
   check_begin_MA = false;
   n = 1;
   s = 1;
   smconst = sm / (1 + Cycle/2);

   while(shift>=0)
     {
   MA_Short = iMA(NULL,0,MAShort,0, MODE_EMA, PRICE_TYPICAL, shift);
	MA_Long = iMA(NULL,0,MALong,0, MODE_EMA, PRICE_TYPICAL, shift);
	MCD_Arr[n] = MA_Short - MA_Long;
	MCD = MA_Short - MA_Long;

	if (n >= Cycle)
	{
		n = 1; check_begin = true;	} else {n = n + 1;}

	if (check_begin)
	{
		for (i = 1; i<=Cycle; i++)
		{
			if (i == 1) {LLV = MCD_Arr[i];}
			else {
				if (LLV > MCD_Arr[i]) LLV = MCD_Arr[i];
			}

			if (i == 1) {HHV = MCD_Arr[i];}
			else {
				if (HHV < MCD_Arr[i]) HHV = MCD_Arr[i];
			}
		}
		ST = ((MCD - LLV)/(HHV - LLV))*100 + 0.01;
		s = s + 1;
		if (s >= (Cycle)/2)
		{
			s = 1;
			check_begin_MA = true;
		}
	}	else {ST = 0;}
	if (check_begin_MA) {
		prev = MA[shift + 1];
		MA[shift] = smconst * (ST - prev) + prev;	}
      Comment( MA[shift],MA[shift+1]);
      shift--;

     }

   return(0);
  }
//+------------------------------------------------------------------+
Comments